In this tutorial, you will learn how to use the capabilities of Keptn to provide self-healing for an application without modifying code. The following tutorial will scale up the pods of an application if the application undergoes heavy CPU saturation.
Please make sure you already have a Keptn installation running. Take a look at these tutorials to get started in case you don't have your Keptn set up yet.
A project in Keptn is the logical unit that can hold multiple (micro)services. Therefore, it is the starting point for each Keptn installation.
To get all files you need for this tutorial, please clone the example repo to your local machine.
git clone --branch release-0.6.2 https://github.com/keptn/examples.git --single-branch

cd examples/onboarding-carts
Create a new project for your services using the keptn create project command. In this example, the project is called sockshop. Before executing the following command, make sure you are in the examples/onboarding-carts folder.
Recommended: Create a new project with Git upstream:
To configure a Git upstream for this tutorial, the Git user (--git-user), an access token (--git-token), and the remote URL (--git-remote-url) are required. If a requirement is not met, go to the Keptn documentation where instructions for GitHub, GitLab, and Bitbucket are provided.
keptn create project sockshop --shipyard=./shipyard.yaml --git-user=GIT_USER --git-token=GIT_TOKEN --git-remote-url=GIT_REMOTE_URL
Alternatively: If you don't want to use a Git upstream, you can create a new project without it but please note that this is not the recommended way:
keptn create project sockshop --shipyard=./shipyard.yaml
For creating the project, the tutorial relies on a shipyard.yaml file as shown below:
stages:
  - name: "dev"
    deployment_strategy: "direct"
    test_strategy: "functional"
  - name: "staging"
    deployment_strategy: "blue_green_service"
    test_strategy: "performance"
  - name: "production"
    deployment_strategy: "blue_green_service"
    remediation_strategy: "automated"
This shipyard contains three stages: dev, staging, and production. This results in the three Kubernetes namespaces: sockshop-dev, sockshop-staging, and sockshop-production.
- dev will have a direct (big bang) deployment strategy and functional tests are executed
- staging will have a blue/green deployment strategy and performance tests are executed
- production will have a blue/green deployment strategy without any further testing. The configured remediation strategy is used for self-healing in production.
After creating the project, services can be onboarded to our project.
- Onboard the carts service using the keptn onboard service command:
keptn onboard service carts --project=sockshop --chart=./carts - After onboarding the service, tests (i.e., functional- and performance tests) need to be added as basis for quality gates in the different stages:
- Functional tests for dev stage:
keptn add-resource --project=sockshop --stage=dev --service=carts --resource=jmeter/basiccheck.jmx --resourceUri=jmeter/basiccheck.jmx - Performance tests for staging stage:
keptn add-resource --project=sockshop --stage=staging --service=carts --resource=jmeter/load.jmx --resourceUri=jmeter/load.jmx
basiccheck.jmxas well asload.jmxfor your service. However, you must not rename the files because there is a hardcoded dependency on these file names in the current implementation of Keptn's jmeter-service. - Functional tests for dev stage:
Since the carts service requires a mongodb database, a second service needs to be onboarded.
- Onboard the carts-db service using the keptn onboard service command. The
--deployment-strategyflag specifies that for this service a direct deployment strategy in all stages should be used regardless of the deployment strategy specified in the shipyard. Thus, the database is not blue/green deployed.keptn onboard service carts-db --project=sockshop --chart=./carts-db --deployment-strategy=direct
After onboarding the services, a built artifact of each service can be deployed.
- Deploy the carts-db service by executing the keptn send event new-artifact command:
keptn send event new-artifact --project=sockshop --service=carts-db --image=docker.io/mongo --tag=4.2.2 - Deploy the carts service by specifying the built artifact, which is stored on DockerHub and tagged with version 0.11.1:
keptn send event new-artifact --project=sockshop --service=carts --image=docker.io/keptnexamples/carts --tag=0.11.1 - Go to Keptn's Bridge and check which events have already been generated. You can access it by a port-forward from your local machine to the Kubernetes cluster:
kubectl port-forward svc/bridge -n keptn 9000:8080 - The Keptn's Bridge is then available on http://localhost:9000.
It shows all deployments that have been triggered. On the left-hand side, you can see the deployment start events (i.e., so-calledConfiguration changeevents). During a deployment, Keptn generates events for controlling the deployment process. These events will also show up in Keptn's Bridge. Please note that if events are sent at the same time, their order in the Keptn's Bridge might be arbitrary since they are sorted on the granularity of one second.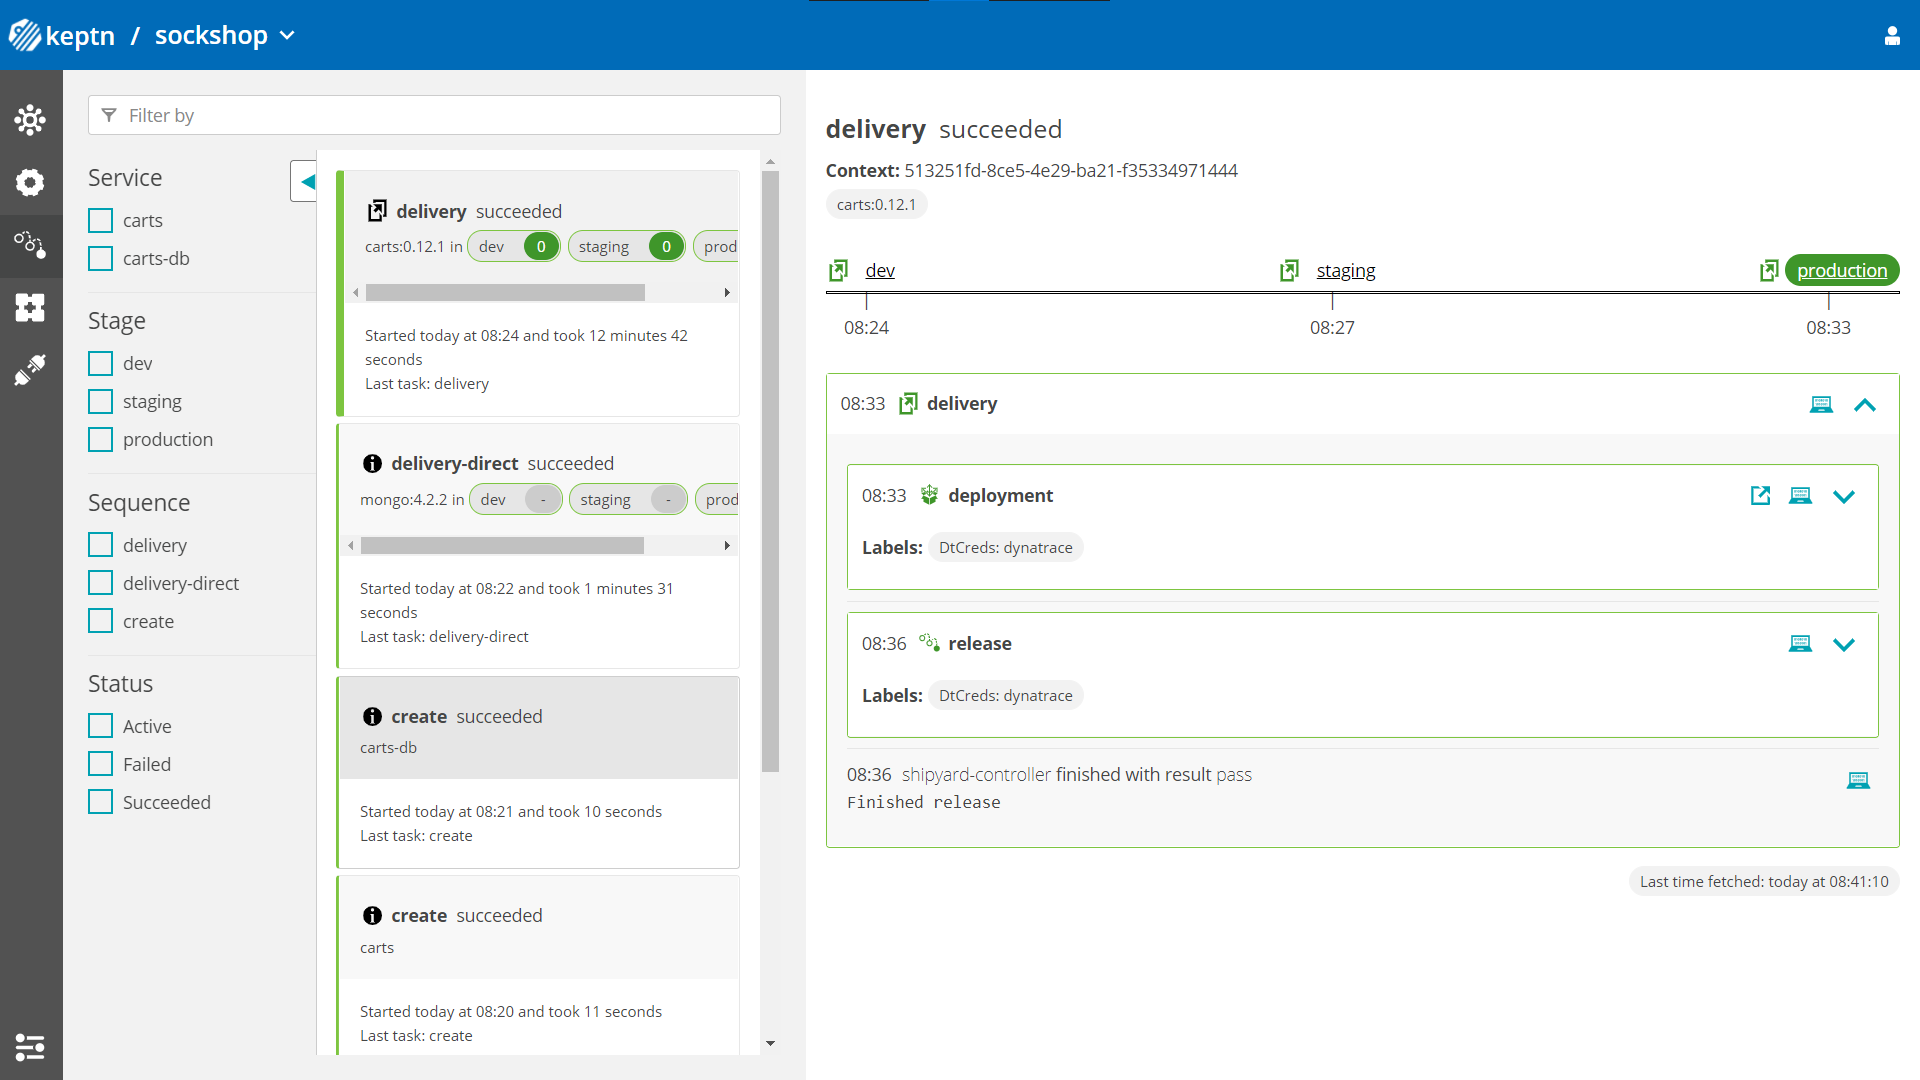
- Optional: Verify the pods that should have been created for services carts and carts-db:
kubectl get pods --all-namespaces | grep cartssockshop-dev carts-77dfdc664b-25b74 1/1 Running 0 10m sockshop-dev carts-db-54d9b6775-lmhf6 1/1 Running 0 13m sockshop-production carts-db-54d9b6775-4hlwn 2/2 Running 0 12m sockshop-production carts-primary-79bcc7c99f-bwdhg 2/2 Running 0 2m15s sockshop-staging carts-db-54d9b6775-rm8rw 2/2 Running 0 12m sockshop-staging carts-primary-79bcc7c99f-mbbgq 2/2 Running 0 7m24s
- Get the URL for your carts service with the following commands in the respective namespaces:
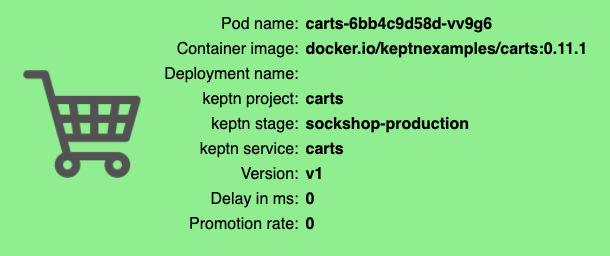
echo http://carts.sockshop-dev.$(kubectl get cm keptn-domain -n keptn -o=jsonpath='{.data.app_domain}')echo http://carts.sockshop-staging.$(kubectl get cm keptn-domain -n keptn -o=jsonpath='{.data.app_domain}')echo http://carts.sockshop-production.$(kubectl get cm keptn-domain -n keptn -o=jsonpath='{.data.app_domain}') - Navigate to the URLs to inspect the carts service. In the production namespace, you should receive an output similar to this:
Now that the service is running in all three stages, let us generate some traffic so we have some data we can base the evaluation on.
Change the directory to examples/load-generation/cartsloadgen. If you are still in the onboarding-carts directory, use the following command or change it accordingly:
cd ../load-generation/cartsloadgen
Now let us deploy a pod that will generate some traffic for all three stages of our demo environment.
kubectl apply -f deploy/cartsloadgen-base.yaml
The output will look similar to this.
namespace/loadgen created
deployment.extensions/cartsloadgen created
Optionally, you can verify that the load generator has been started.
kubectl get pods -n loadgen

NAME                            READY   STATUS    RESTARTS   AGE
cartsloadgen-5dc47c85cf-kqggb   1/1     Running   0          117s
For enabling the Keptn Quality Gates, we are going to use Dynatrace as the data provider. Therefore, we are going to setup Dynatrace in our Kubernetes cluster to have our sample application monitored and we can use the monitoring data for both the basis for evaluating quality gates as well as a trigger to start self-healing.
If you don't have a Dynatrace tenant yet, sign up for a free trial or a developer account.
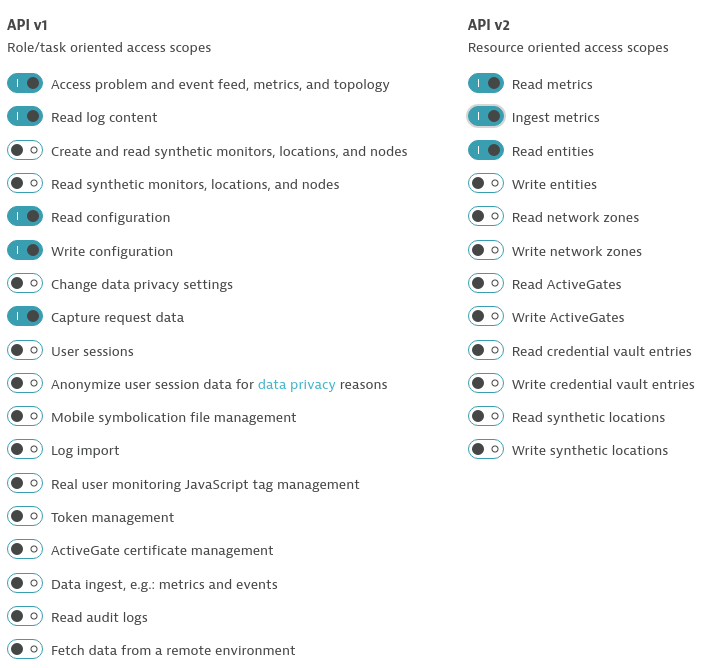
- Create a Dynatrace API TokenLog in to your Dynatrace tenant and go to Settings > Integration > Dynatrace API. Then, create a new API token with the following permissions:
- Access problem and event feed, metrics, and topology
- Read log content
- Read configuration
- Write configuration
- Capture request data
- Read metrics
- Ingest metrics
- Read entities
- Create a Dynatrace PaaS TokenIn your Dynatrace tenant, go to Settings > Integration > Platform as a Service, and create a new PaaS Token.
- Store your credentials in a Kubernetes secret by executing the following command. The
DT_TENANThas to be set according to the appropriate pattern:- Dynatrace SaaS tenant (this format is most likely for you):
{your-environment-id}.live.dynatrace.com - Dynatrace-managed tenant:
{your-domain}/e/{your-environment-id}
kubectlcommand itself.
If you used the variables, the next command can be copied and pasted without modifications. If you have not set the variable, please make sure to set the right values in the next command.DT_TENANT=yourtenant.live.dynatrace.com DT_API_TOKEN=yourAPItoken DT_PAAS_TOKEN=yourPAAStokenkubectl -n keptn create secret generic dynatrace --from-literal="DT_TENANT=$DT_TENANT" --from-literal="DT_API_TOKEN=$DT_API_TOKEN" --from-literal="DT_PAAS_TOKEN=$DT_PAAS_TOKEN" - Dynatrace SaaS tenant (this format is most likely for you):
- The Dynatrace integration into Keptn is handled by the dynatrace-service. To install the dynatrace-service, execute:
kubectl apply -f https://raw.githubusercontent.com/keptn-contrib/dynatrace-service/0.7.1/deploy/manifests/dynatrace-service/dynatrace-service.yaml - When the service is deployed, use the following command to install Dynatrace on your cluster. If Dynatrace is already deployed, the current deployment of Dynatrace will not be modified.
keptn configure monitoring dynatrace
Verify Dynatrace configuration
Since Keptn has configured your Dynatrace tenant, let us take a look what has be done for you:
- Tagging rules: When you navigate to Settings > Tags > Automatically applied tags in your Dynatrace tenant, you will find following tagging rules:
- keptn_deployment
- keptn_project
- keptn_service
- keptn_stage
- Problem notification: A problem notification has been set up to inform Keptn of any problems with your services to allow auto-remediation. You can check the problem notification by navigating to Settings > Integration > Problem notifications and you will find a keptn remediation problem notification.
- Alerting profile: An alerting profile with all problems set to 0 minutes (immediate) is created. You can review this profile by navigating to Settings > Alerting > Alerting profiles.
- Dashboard and Management zone: When creating a new Keptn project or executing the keptn configure monitoring command for a particular project (see Note 1), a dashboard and management zone will be generated reflecting the environment as specified in the shipyard file.
Follow the next steps only if your Dynatrace OneAgent does not work properly.
- To check if the OneAgent does not work properly, the output of
kubectl get pods -n dynatracemight look as follows:NAME READY STATUS RESTARTS AGE dynatrace-oneagent-operator-7f477bf78d-dgwb6 1/1 Running 0 8m21s oneagent-b22m4 0/1 Error 6 8m15s oneagent-k7jn6 0/1 CrashLoopBackOff 6 8m15s - This means that after the initial setup you need to edit the OneAgent custom resource in the Dynatrace namespace and add the following entry to the env section:
env: - name: ONEAGENT_ENABLE_VOLUME_STORAGE value: "true" - To edit the OneAgent custom resource:
kubectl edit oneagent -n dynatrace
At the end of your installation, please verify that all Dynatrace resources are in a Ready and Running status by executing kubectl get pods -n dynatrace:
NAME                                           READY   STATUS       RESTARTS   AGE
dynatrace-oneagent-operator-7f477bf78d-dgwb6   1/1     Running      0          8m21s
oneagent-b22m4                                 1/1     Running      0          8m21s
oneagent-k7jn6                                 1/1     Running      0          8m21s
To inform Keptn about any issues in a production environment, monitoring has to be set up correctly. The Keptn CLI helps with the automated setup and configuration of Dynatrace as the monitoring solution running in the Kubernetes cluster.
To add these files to Keptn and to automatically configure Dynatrace, execute the following commands:
- Make sure you are in the correct folder of your examples directory:
cd examples/onboarding-carts - Configure remediation actions for up-scaling based on Dynatrace alerts:
This is how the file looks that we are going to add here:keptn add-resource --project=sockshop --stage=production --service=carts --resource=remediation.yaml --resourceUri=remediation.yamlremediations: - name: response_time_p90 actions: - action: scaling value: +1 - name: Response time degradation actions: - action: scaling value: +1 - Configure Dynatrace with the Keptn CLI (we have done this earlier already but we make sure that our project is configured correctly):
keptn configure monitoring dynatrace --project=sockshop
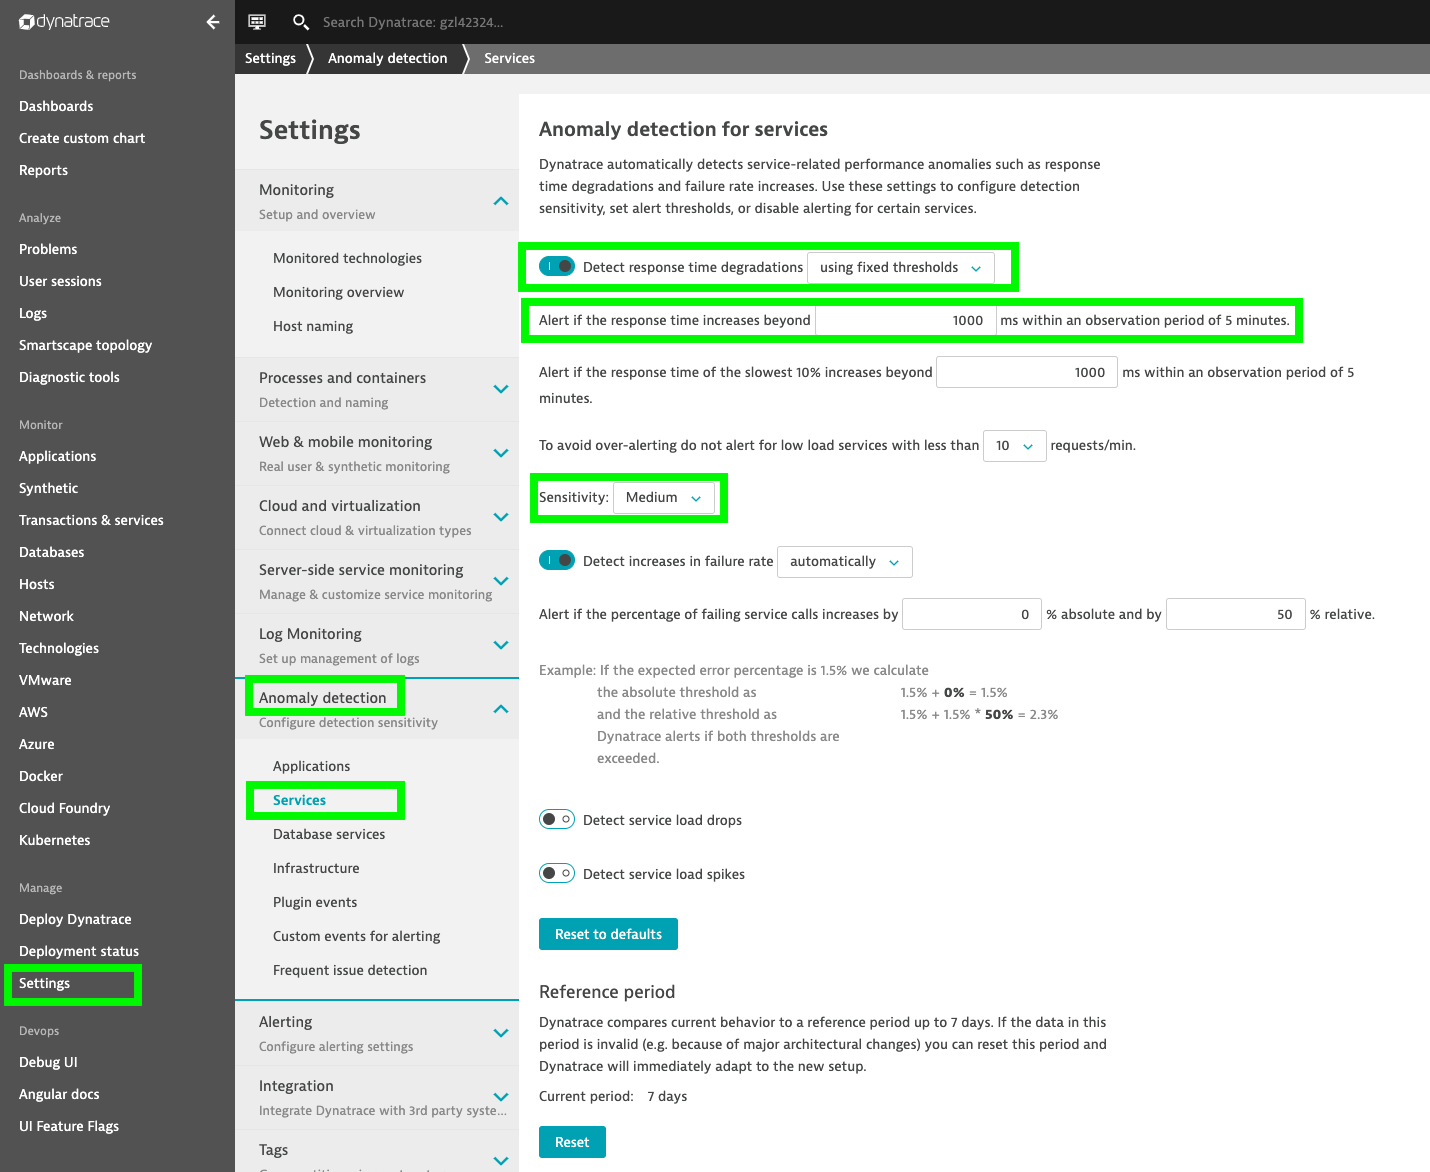
Configure Dynatrace problem detection with a fixed threshold: For the sake of this demo, we will configure Dynatrace to detect problems based on fixed thresholds rather than automatically.
Log in to your Dynatrace tenant and go to Settings > Anomaly Detection > Services.
Within this menu, select the option Detect response time degradations using fixed thresholds, set the limit to 1000ms, and select Medium for the sensitivity as shown below.
To simulate user traffic that is causing an unhealthy behavior in the carts service, please execute the following script. This will add special items into the shopping cart that cause some extensive calculation.
- Move to the correct folder for the load generation scripts:
cd ../load-generation/cartsloadgen/deploy - Start the load generation script:
kubectl apply -f cartsloadgen-faulty.yaml - Start the load generation script depending on your OS (replace _OS_ with linux, mac, or win):
./loadgenerator-_OS_ "http://carts.sockshop-production.$(kubectl get cm keptn-domain -n keptn -o=jsonpath='{.data.app_domain}')" cpu - Optional: Verify the load in DynatraceIn your Dynatrace Tenant, inspect the Response Time chart of the correlating service entity of the carts microservice. Hint: You can find the service
in Dynatrace easier by selecting the management zone Keptn: sockshop production: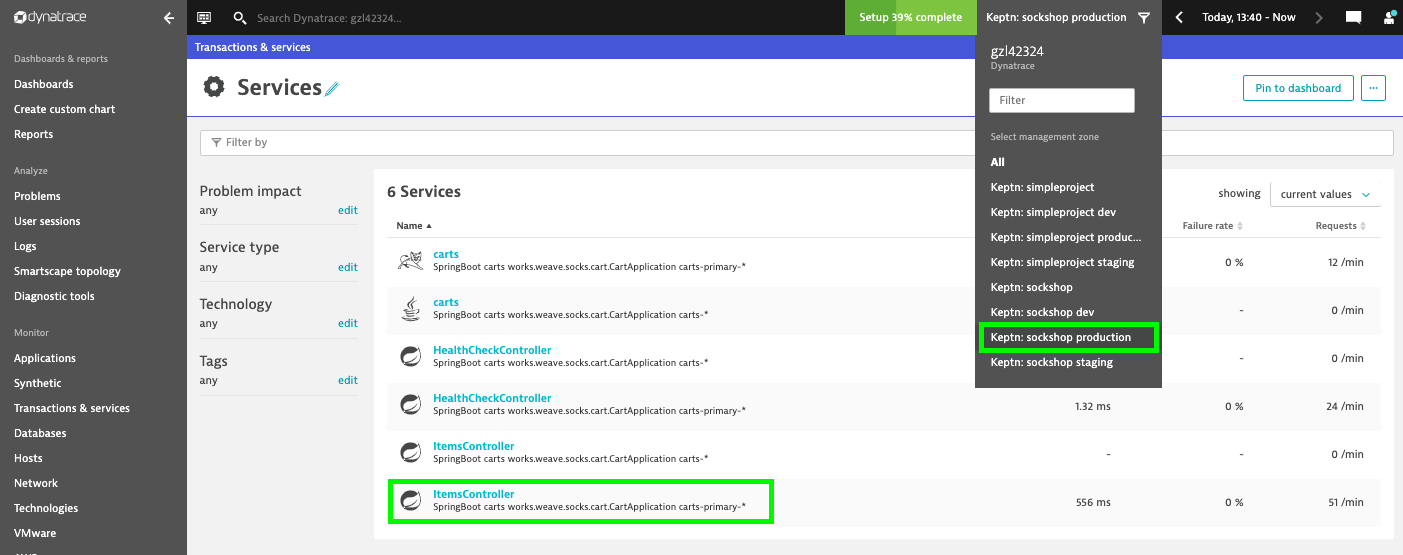
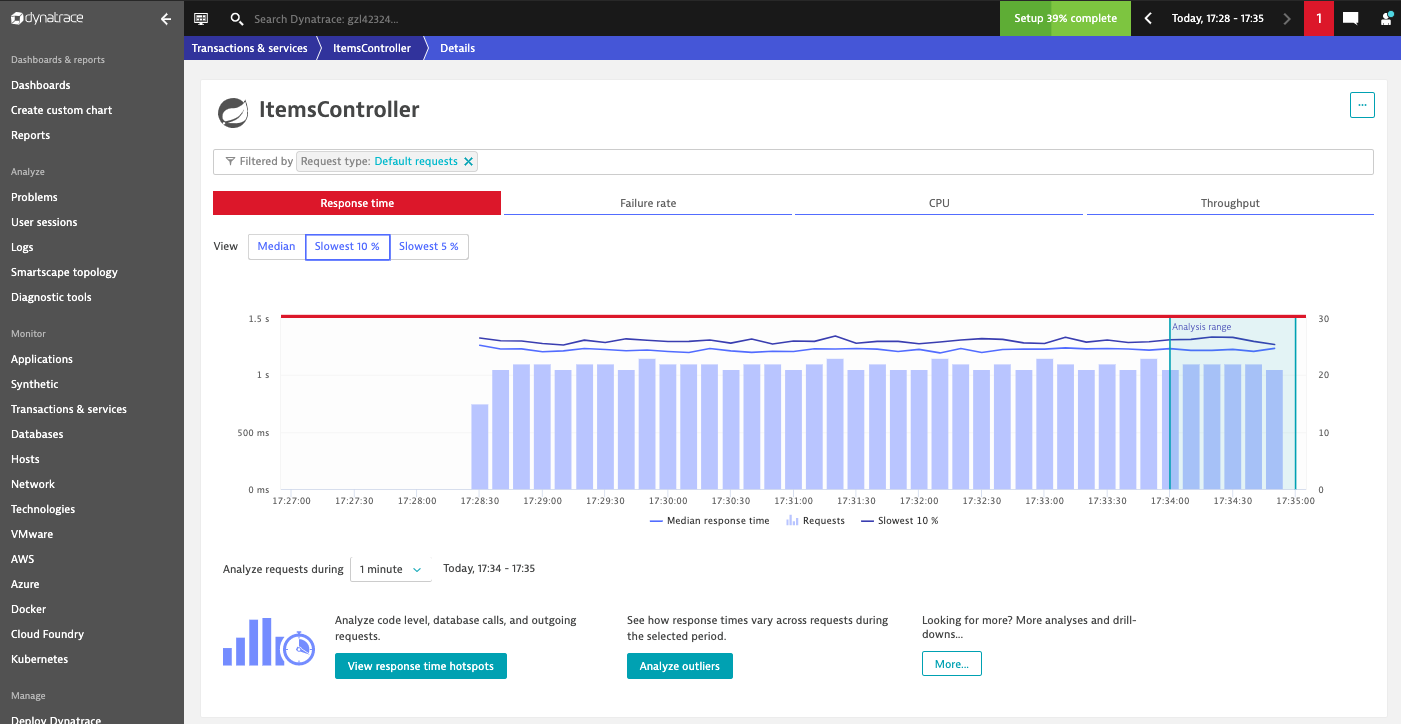
As you can see in the time series chart, the load generation script causes a significant increase in the response time.
After approximately 10-15 minutes, Dynatrace will send out a problem notification because of the response time degradation.
After receiving the problem notification, the dynatrace-service will translate it into a Keptn CloudEvent. This event will eventually be received by the remediation-service that will look for a remediation action specified for this type of problem and, if found, execute it.
In this tutorial, the number of pods will be increased to remediate the issue of the response time increase.
- Check the executed remediation actions by executing:
You can see that thekubectl get deployments -n sockshop-productioncarts-primarydeployment is now served by two pods:NAME DESIRED CURRENT UP-TO-DATE AVAILABLE AGE carts-db 1 1 1 1 37m carts-primary 2 2 2 2 32m - Besides, you should see an additional pod running when you execute:
kubectl get pods -n sockshop-productionNAME READY STATUS RESTARTS AGE carts-db-57cd95557b-r6cg8 1/1 Running 0 38m carts-primary-7c96d87df9-75pg7 2/2 Running 0 33m carts-primary-7c96d87df9-78fh2 2/2 Running 0 5m - To get an overview of the actions that got triggered by the response time SLO violation, you can use the Keptn's Bridge. You can access it by a port-forward from your local machine to the Kubernetes cluster:
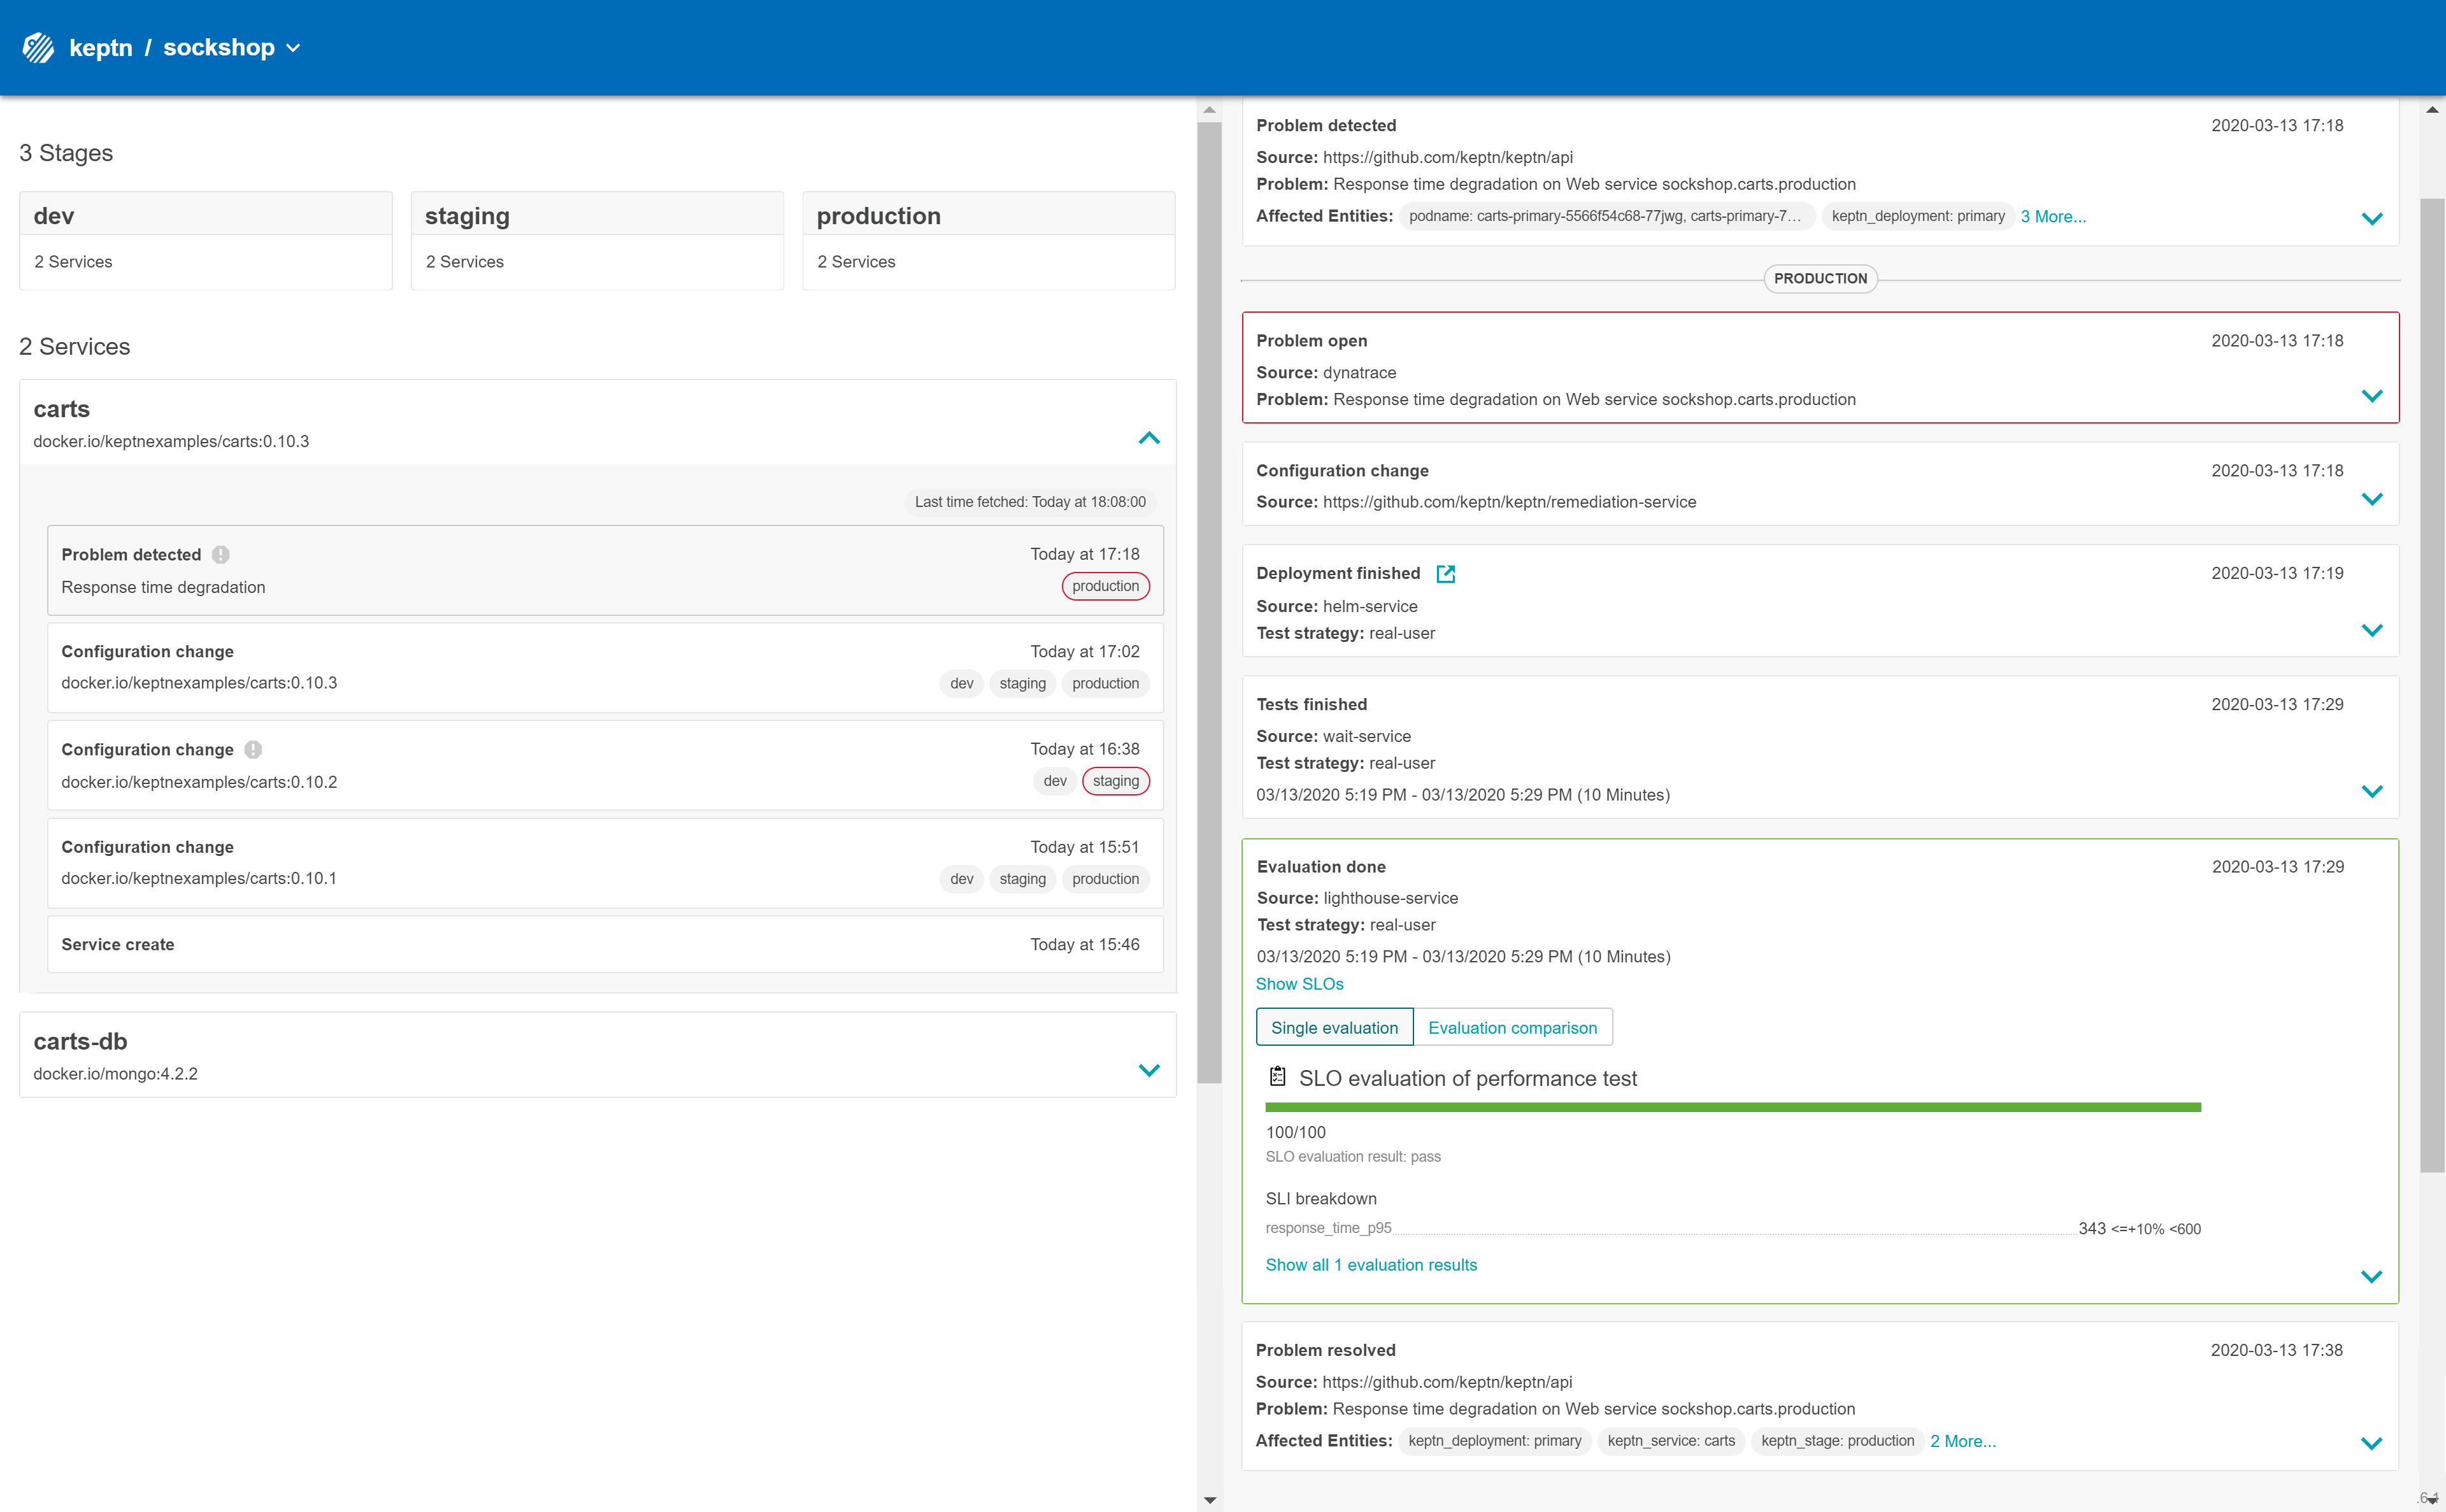
Now access the bridge from your browser on http://localhost:9000.In this example, the bridge shows that the remediation service triggered an update of the configuration of the carts service by increasing the number of replicas to 2. When the additional replica was available, the wait-service waited for 10 minutes for the remediation action to take effect. Afterwards, an evaluation by the lighthouse-service was triggered to check if the remediation action resolved the problem. In this case, increasing the number of replicas achieved the desired effect since the evaluation of the service level objectives has been successful.kubectl port-forward svc/bridge -n keptn 9000:8080
- Furthermore, you can see how the response time of the service decreased by viewing the time series chart in Dynatrace:As previously, go to the response time chart of the ItemsController service. Here you will see that the additional instance has helped to bring down the response time.
Eventually, the problem that has been detected earlier will be closed automatically.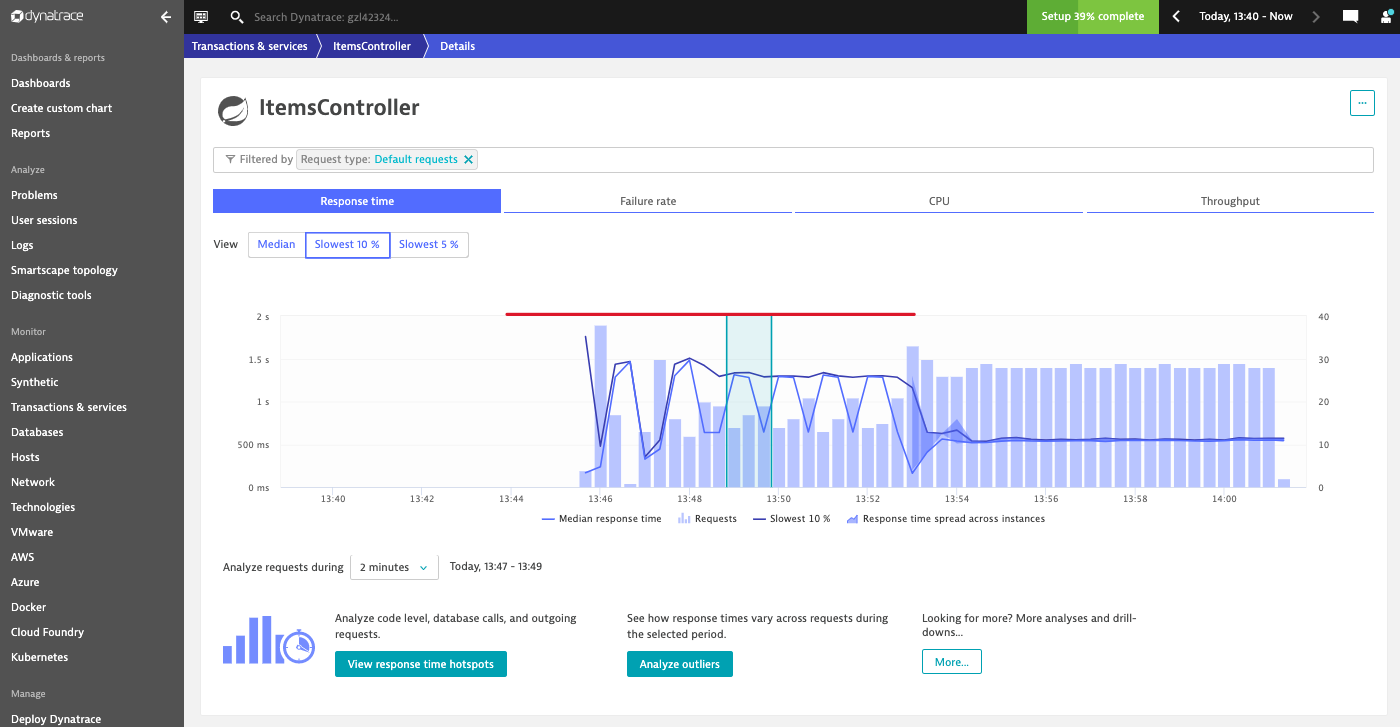
You have successfully walked through the example to scale up your application based on high CPU consumption detected by Dynatrace.
What we've covered
- Setting up auto-remediation with a
remediation.yamlfileremediations: - name: response_time_p90 actions: - action: scaling value: +1 - name: Response time degradation actions: - action: scaling value: +1 - Execute an experiment to see self-healing in action

- Verified that Keptn executed the remediation action
