In this tutorial, you will learn how to use the capabilities of Keptn to provide self-healing for an application without modifying code. The following tutorial will scale up the pods of an application if the application undergoes heavy CPU saturation.
What you'll learn
- How to create a sample project
- How to onboard a first microservice
- How to deploy your first microservice with blue/green deployments
- How to define a remediation file
- How Keptn can automatically execute remediation actions based on issues detected by Dynatrace
You'll find a time estimate until the end of this tutorial in the right top corner of your screen - this should give you guidance how much time is needed for each step.
Keptn can be installed on a variety of Kubernetes distributions. Please find a full compatibility matrix for supported Kubernetes versions here.
Please find tutorials how to set up your cluster here. For the best tutorial experience, please follow the sizing recommendations given in the tutorials.
Please make sure your environment matches these prerequisites:
- kubectl
- Linux or MacOS (preferred as some instructions are targeted for these platforms)
- On Windows: Git Bash 4 Windows, WSL
Download the Istio command line tool by following the official instructions or by executing the following steps.
curl -L https://istio.io/downloadIstio | ISTIO_VERSION=1.8.2 sh -
Check the version of Istio that has been downloaded and execute the installer from the corresponding folder, e.g.,
./istio-1.8.2/bin/istioctl install
The installation of Istio should be finished within a couple of minutes.
This will install the Istio default profile with ["Istio core" "Istiod" "Ingress gateways"] components into the cluster. Proceed? (y/N) y
✔ Istio core installed
✔ Istiod installed
✔ Ingress gateways installed
✔ Installation complete
Every release of Keptn provides binaries for the Keptn CLI. These binaries are available for Linux, macOS, and Windows.
There are multiple options how to get the Keptn CLI on your machine.
- Easiest option, if you are running on a Linux or Mac OS:
This will download and install the Keptn CLI automatically.curl -sL https://get.keptn.sh | sudo -E bash - Another option is to manually download the current release of the Keptn CLI:
- Download the version for your operating system from Download CLI
- Unpack the download
- Find the
keptnbinary in the unpacked directory - Linux / macOS: Add executable permissions (
chmod +x keptn), and move it to the desired destination (e.g.mv keptn /usr/local/bin/keptn)
- Windows: Copy the executable to the desired folder and add the executable to your PATH environment variable.
Now, you should be able to run the Keptn CLI:
- Linux / macOS
keptn --help - Windows
.\keptn.exe --help
To install the latest release of Keptn with full quality gate + continuous delivery capabilities in your Kubernetes cluster, execute the keptn install command.
keptn install --endpoint-service-type=ClusterIP --use-case=continuous-delivery
Installation details
In the Keptn namespace, the following deployments should be found:
kubectl get deployments -n keptn
Here is the output of the command:
NAME                                             READY   UP-TO-DATE   AVAILABLE   AGE
api-gateway-nginx                                1/1     1            1           2m44s
api-service                                      1/1     1            1           2m44s
bridge                                           1/1     1            1           2m44s
configuration-service                            1/1     1            1           2m44s
eventbroker-go                                   1/1     1            1           2m44s
gatekeeper-service                               1/1     1            1           2m44s
helm-service                                     1/1     1            1           2m44s
helm-service-continuous-deployment-distributor   1/1     1            1           2m44s
jmeter-service                                   1/1     1            1           2m44s
lighthouse-service                               1/1     1            1           2m44s
mongodb                                          1/1     1            1           2m44s
mongodb-datastore                                1/1     1            1           2m44s
remediation-service                              1/1     1            1           2m44s
shipyard-service                                 1/1     1            1           2m44s
We are using Istio for traffic routing and as an ingress to our cluster. To make the setup experience as smooth as possible we have provided some scripts for your convenience. If you want to run the Istio configuration yourself step by step, please take a look at the Keptn documentation.
The first step for our configuration automation for Istio is downloading the configuration bash script from Github:
curl -o configure-istio.sh https://raw.githubusercontent.com/keptn/examples/release-0.7.3/istio-configuration/configure-istio.sh
After that you need to make the file executable using the chmod command.
chmod +x configure-istio.sh
Finally, let's run the configuration script to automatically create your Ingress resources.
./configure-istio.sh
What is actually created
With this script, you have created an Ingress based on the following manifest.
---
apiVersion: networking.k8s.io/v1beta1
kind: Ingress
metadata:
  annotations:
    kubernetes.io/ingress.class: istio
  name: api-keptn-ingress
  namespace: keptn
spec:
  rules:
  - host: <IP-ADDRESS>.nip.io
    http:
      paths:
      - backend:
          serviceName: api-gateway-nginx
          servicePort: 80
Besides, the script has created a gateway resource for you so that the onboarded services are also available publicly.
---
apiVersion: networking.istio.io/v1alpha3
kind: Gateway
metadata:
  name: public-gateway
  namespace: istio-system
spec:
  selector:
    istio: ingressgateway
  servers:
  - port:
      name: http
      number: 80
      protocol: HTTP
    hosts:
    - '*'
Besides, the helm-service pod of Keptn is restarted to fetch this new configuration.
In this section we are referring to the Linux/MacOS derivatives of the commands. If you are using a Windows host, please follow the official instructions.
KEPTN_ENDPOINT=http://$(kubectl -n keptn get ingress api-keptn-ingress -ojsonpath='{.spec.rules[0].host}')/api
KEPTN_API_TOKEN=$(kubectl get secret keptn-api-token -n keptn -ojsonpath='{.data.keptn-api-token}' | base64 --decode)
Use this stored information and authenticate the CLI.
keptn auth --endpoint=$KEPTN_ENDPOINT --api-token=$KEPTN_API_TOKEN
That will give you:
Starting to authenticate
Successfully authenticated
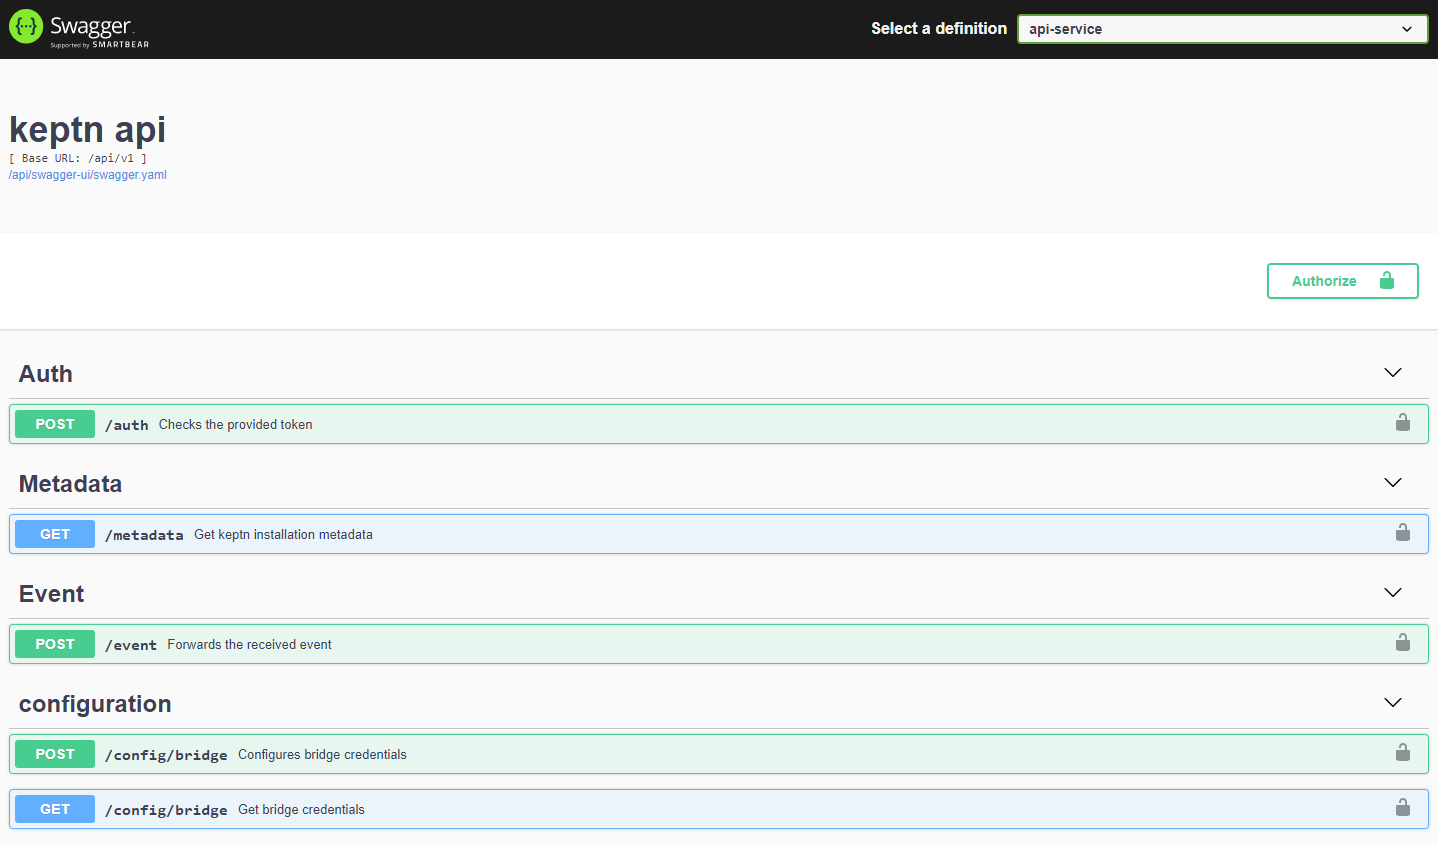
If you want, you can go ahead and take a look at the Keptn API by navigating to the endpoint that is given via
echo $KEPTN_ENDPOINT
For enabling the Keptn Quality Gates and for production monitoring, we are going to use Dynatrace as the data provider. Therefore, we are going to setup Dynatrace in our Kubernetes cluster to have our sample application monitored and we can use the monitoring data for both the basis for evaluating quality gates as well as a trigger to start self-healing.
If you don't have a Dynatrace tenant yet, sign up for a free trial or a developer account.
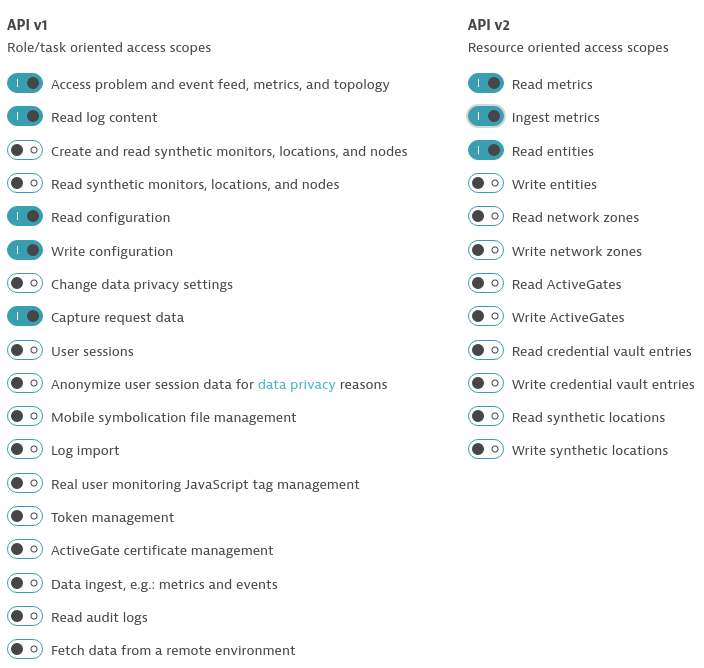
- Create a Dynatrace API TokenLog in to your Dynatrace tenant and go to Settings > Integration > Dynatrace API. Then, create a new API token with the following permissions:
- Access problem and event feed, metrics, and topology
- Read log content
- Read configuration
- Write configuration
- Capture request data
- Read metrics
- Ingest metrics
- Read entities
- Create a Dynatrace PaaS TokenIn your Dynatrace tenant, go to Settings > Integration > Platform as a Service, and create a new PaaS Token.
- Store your credentials in a Kubernetes secret by executing the following command. The
DT_TENANThas to be set according to the appropriate pattern:- Dynatrace SaaS tenant (this format is most likely for you):
{your-environment-id}.live.dynatrace.com - Dynatrace-managed tenant:
{your-domain}/e/{your-environment-id}
kubectlcommand itself.
If you used the variables, the next command can be copied and pasted without modifications. If you have not set the variables, please make sure to set the right values in the next command.export DT_TENANT=yourtenant.live.dynatrace.com export DT_API_TOKEN=yourAPItoken export DT_PAAS_TOKEN=yourPAAStokenkubectl -n keptn create secret generic dynatrace --from-literal="DT_TENANT=$DT_TENANT" --from-literal="DT_API_TOKEN=$DT_API_TOKEN" --from-literal="DT_PAAS_TOKEN=$DT_PAAS_TOKEN" --from-literal="KEPTN_API_URL=http://$(kubectl -n keptn get ingress api-keptn-ingress -ojsonpath='{.spec.rules[0].host}')/api" --from-literal="KEPTN_API_TOKEN=$(kubectl get secret keptn-api-token -n keptn -ojsonpath='{.data.keptn-api-token}' | base64 --decode)" --from-literal="KEPTN_BRIDGE_URL=http://$(kubectl -n keptn get ingress api-keptn-ingress -ojsonpath='{.spec.rules[0].host}')/bridge" - Dynatrace SaaS tenant (this format is most likely for you):
To make the tutorial experience as smooth as possible, we are providing an automation script to setup the Dynatrace OneAgent operator in your Kubernetes cluster. For details on the installation, we refer to the official Dynatrace documentation. You can download and run the script using the following instructions.
- Downloading the automation file.
curl -o deploy-dynatrace-oneagent.sh https://raw.githubusercontent.com/keptn/examples/release-0.7.2/dynatrace-oneagent/deploy-dynatrace-oneagent.sh - Making the file executable using the
chmodcommand.chmod +x deploy-dynatrace-oneagent.sh - Executing the script to automatically deploys the Dynatrace OneAgent Operator.
./deploy-dynatrace-oneagent.sh - Optional: Verify if all pods in the Dynatrace namespace are running. It might take up to 1-2 minutes for all pods to be up and running.
kubectl get pods -n dynatracedynatrace-oneagent-operator-696fd89b76-n9d9n 1/1 Running 0 6m26s dynatrace-oneagent-webhook-78b6d99c85-h9759 2/2 Running 0 6m25s oneagent-g9m42 1/1 Running 0 69s
Follow the next steps only if your Dynatrace OneAgent does not work properly.
- To check if the OneAgent does not work properly, the output of
kubectl get pods -n dynatracemight look as follows:NAME READY STATUS RESTARTS AGE dynatrace-oneagent-operator-7f477bf78d-dgwb6 1/1 Running 0 8m21s oneagent-b22m4 0/1 Error 6 8m15s oneagent-k7jn6 0/1 CrashLoopBackOff 6 8m15s - This means that after the initial setup you need to edit the OneAgent custom resource in the Dynatrace namespace and add the following entry to the env section:
env: - name: ONEAGENT_ENABLE_VOLUME_STORAGE value: "true" - To edit the OneAgent custom resource:
kubectl edit oneagent -n dynatrace
At the end of your installation, please verify that all Dynatrace resources are in a Ready and Running status by executing kubectl get pods -n dynatrace:
NAME                                           READY   STATUS       RESTARTS   AGE
dynatrace-oneagent-operator-7f477bf78d-dgwb6   1/1     Running      0          8m21s
oneagent-b22m4                                 1/1     Running      0          8m21s
oneagent-k7jn6                                 1/1     Running      0          8m21s
- The Dynatrace integration into Keptn is handled by the dynatrace-service. To install the dynatrace-service, execute:
kubectl apply -f https://raw.githubusercontent.com/keptn-contrib/dynatrace-service/release-0.10.4/deploy/service.yaml -n keptn - When the service is deployed, use the following command to install Dynatrace on your cluster. If Dynatrace is already deployed, the current deployment of Dynatrace will not be modified.
Output should be similar to this:keptn configure monitoring dynatraceID of Keptn context: 79f19c36-b718-4bb6-88d5-cb79f163289b Configuring Dynatrace monitoring Dynatrace OneAgent Operator is installed on cluster Setting up auto-tagging rules in Dynatrace Tenant Tagging rule keptn_service already exists Tagging rule keptn_stage already exists Tagging rule keptn_project already exists Tagging rule keptn_deployment already exists Setting up problem notifications in Dynatrace Tenant Checking Keptn alerting profile availability Keptn alerting profile available Dynatrace Monitoring setup done
Verify Dynatrace configuration
Since Keptn has configured your Dynatrace tenant, let us take a look what has be done for you:
- Tagging rules: When you navigate to Settings > Tags > Automatically applied tags in your Dynatrace tenant, you will find following tagging rules:
- keptn_deployment
- keptn_project
- keptn_service
- keptn_stage
- Problem notification: A problem notification has been set up to inform Keptn of any problems with your services to allow auto-remediation. You can check the problem notification by navigating to Settings > Integration > Problem notifications and you will find a keptn remediation problem notification.
- Alerting profile: An alerting profile with all problems set to 0 minutes (immediate) is created. You can review this profile by navigating to Settings > Alerting > Alerting profiles.
- Dashboard and Management zone: When creating a new Keptn project or executing the keptn configure monitoring command for a particular project (see Note 1), a dashboard and management zone will be generated reflecting the environment as specified in the shipyard file.
A project in Keptn is the logical unit that can hold multiple (micro)services. Therefore, it is the starting point for each Keptn installation.
To get all files you need for this tutorial, please clone the example repo to your local machine.
git clone --branch release-0.7.3 https://github.com/keptn/examples.git --single-branch

cd examples/onboarding-carts
Create a new project for your services using the keptn create project command. In this example, the project is called sockshop. Before executing the following command, make sure you are in the examples/onboarding-carts folder.
Recommended: Create a new project with Git upstream:
To configure a Git upstream for this tutorial, the Git user (--git-user), an access token (--git-token), and the remote URL (--git-remote-url) are required. If a requirement is not met, go to the Keptn documentation where instructions for GitHub, GitLab, and Bitbucket are provided.
Let's define the variables before running the command:
GIT_USER=gitusername
GIT_TOKEN=gittoken
GIT_REMOTE_URL=remoteurl
Now let's create the project using the keptn create project command.
keptn create project sockshop --shipyard=./shipyard.yaml --git-user=$GIT_USER --git-token=$GIT_TOKEN --git-remote-url=$GIT_REMOTE_URL
Alternatively: If you don't want to use a Git upstream, you can create a new project without it but please note that this is not the recommended way:
keptn create project sockshop --shipyard=./shipyard.yaml
For creating the project, the tutorial relies on a shipyard.yaml file as shown below:
stages:
  - name: "dev"
    deployment_strategy: "direct"
    test_strategy: "functional"
  - name: "staging"
    approval_strategy:
      pass: "automatic"
      warning: "automatic"
    deployment_strategy: "blue_green_service"
    test_strategy: "performance"
  - name: "production"
    approval_strategy:
      pass: "automatic"
      warning: "manual"
    deployment_strategy: "blue_green_service"
    remediation_strategy: "automated"
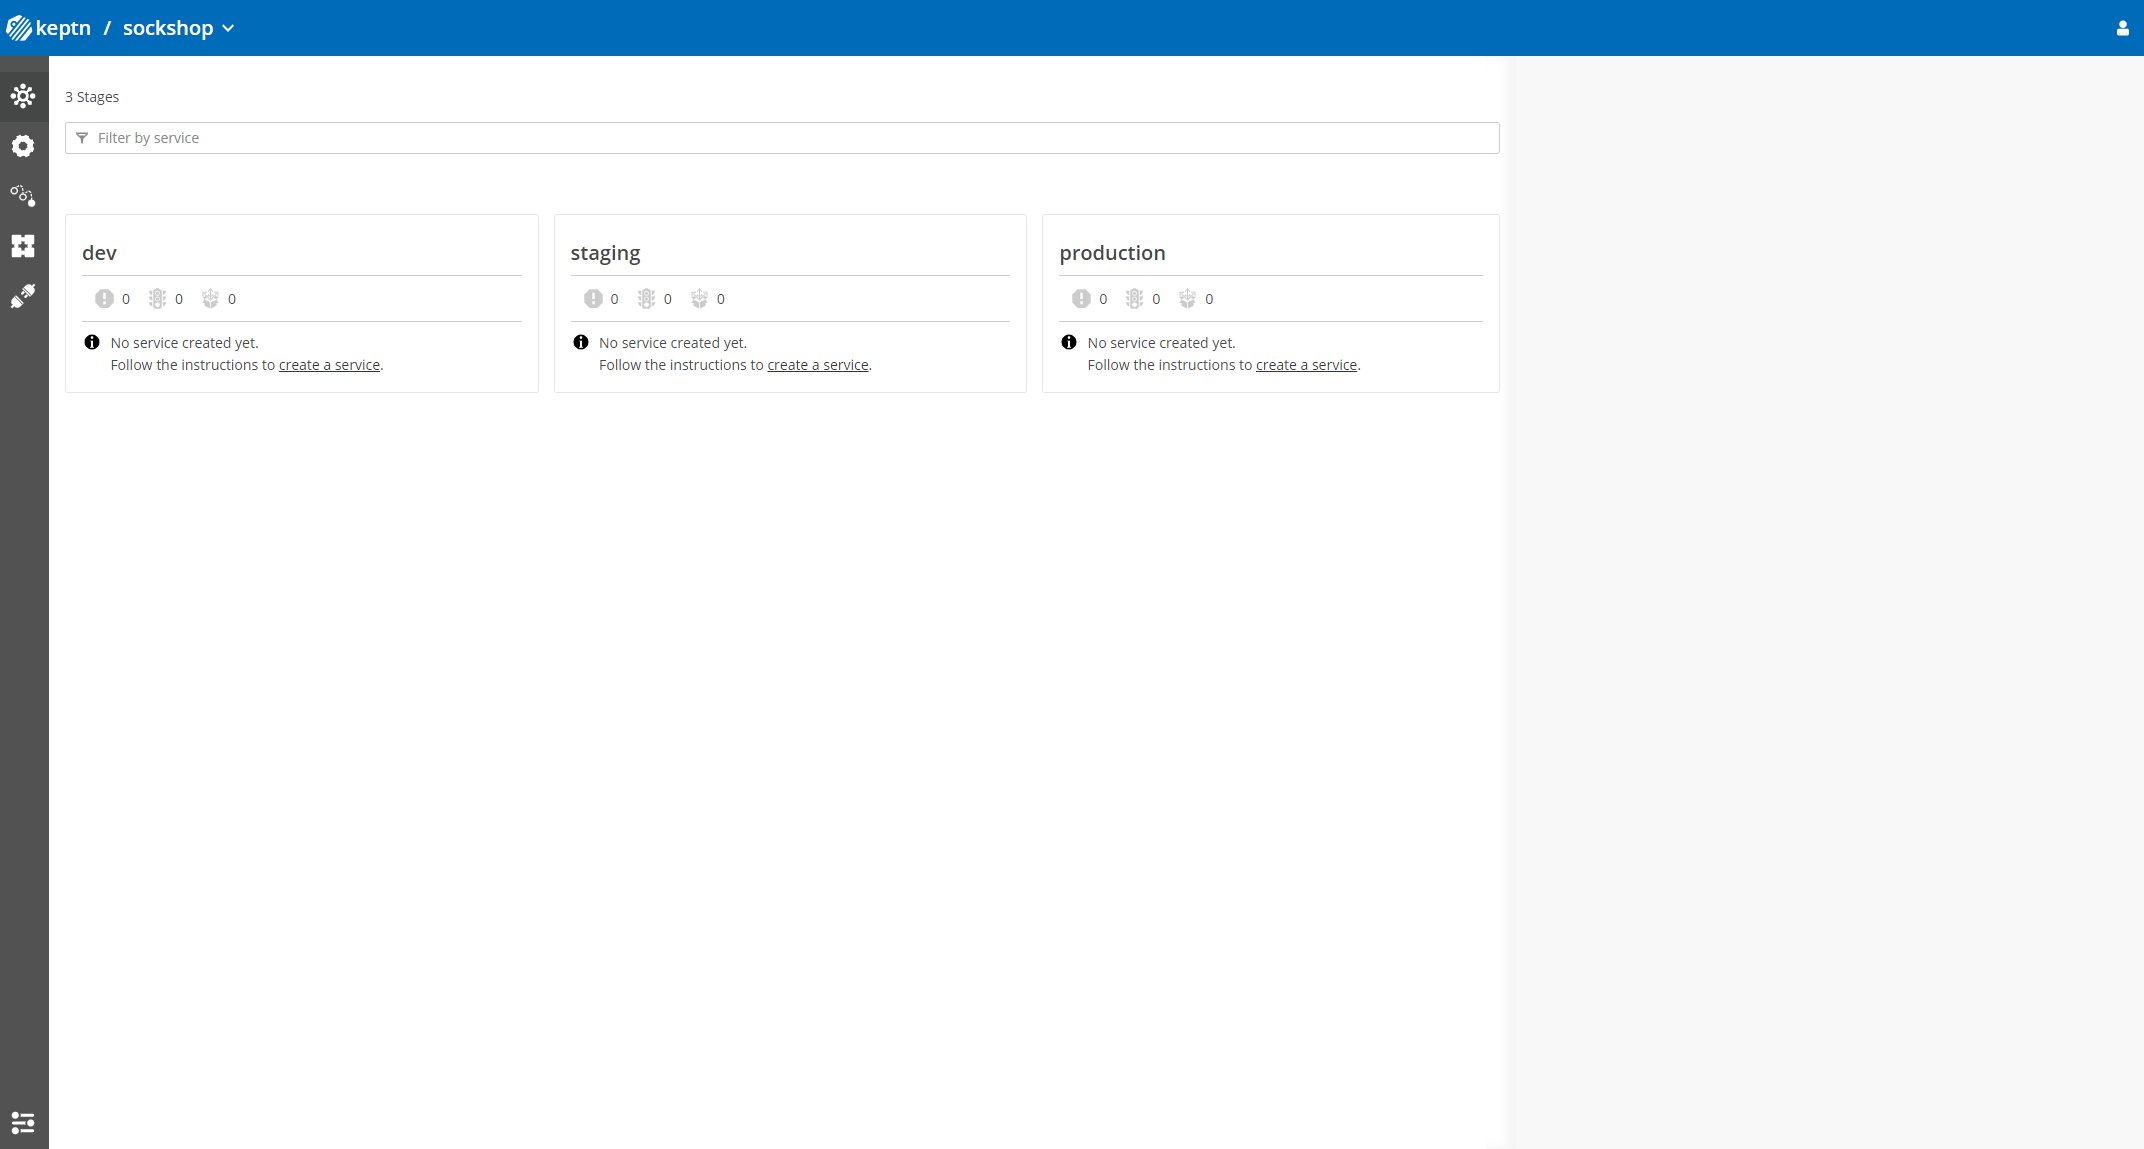
This shipyard contains three stages: dev, staging, and production. This results in the three Kubernetes namespaces: sockshop-dev, sockshop-staging, and sockshop-production.
- dev will have a direct (big bang) deployment strategy and functional tests are executed
- staging will have a blue/green deployment strategy with automated approvals for passing quality gates as well as quality gates which result in warnings. As configured, performance tests are executed.
- production will have a blue/green deployment strategy without any further testing. Approvals are done automatically for passed quality gates but manual approval is needed for quality gate evaluations that result in a warning. The configured remediation strategy is used for self-healing in production.
Let's take a look at the project that we have just created. We can find all this information in the Keptn's Bridge.
Therefore, we need the credentials that have been automatically generated for us.
keptn configure bridge --output
Now use these credentials to access it on your Keptn's Bridge.
echo http://$(kubectl -n keptn get ingress api-keptn-ingress -ojsonpath='{.spec.rules[0].host}')/bridge
You will find the just created project in the bridge with all stages.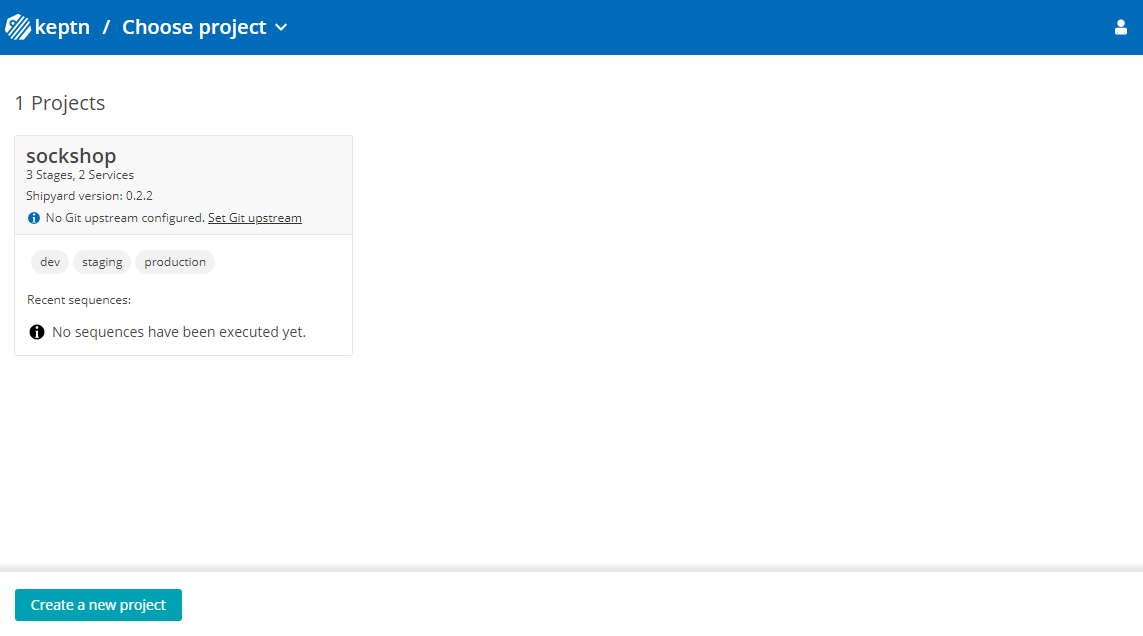
After creating the project, services can be onboarded to our project.
- Onboard the carts service using the keptn onboard service command:
keptn onboard service carts --project=sockshop --chart=./carts - After onboarding the service, tests (i.e., functional- and performance tests) need to be added as basis for quality gates in the different stages:
- Functional tests for dev stage:
keptn add-resource --project=sockshop --stage=dev --service=carts --resource=jmeter/basiccheck.jmx --resourceUri=jmeter/basiccheck.jmx- Performance tests for staging stage:
Note: You can adapt the tests inkeptn add-resource --project=sockshop --stage=staging --service=carts --resource=jmeter/load.jmx --resourceUri=jmeter/load.jmxbasiccheck.jmxas well asload.jmxfor your service. However, you must not rename the files because there is a hardcoded dependency on these file names in the current implementation of Keptn's jmeter-service.
Since the carts service requires a mongodb database, a second service needs to be onboarded.
- Onboard the carts-db service using the keptn onboard service command. The
--deployment-strategyflag specifies that for this service a direct deployment strategy in all stages should be used regardless of the deployment strategy specified in the shipyard. Thus, the database is not blue/green deployed.keptn onboard service carts-db --project=sockshop --chart=./carts-db --deployment-strategy=direct
Take a look in your Keptn's Bridge and see the newly onboarded services.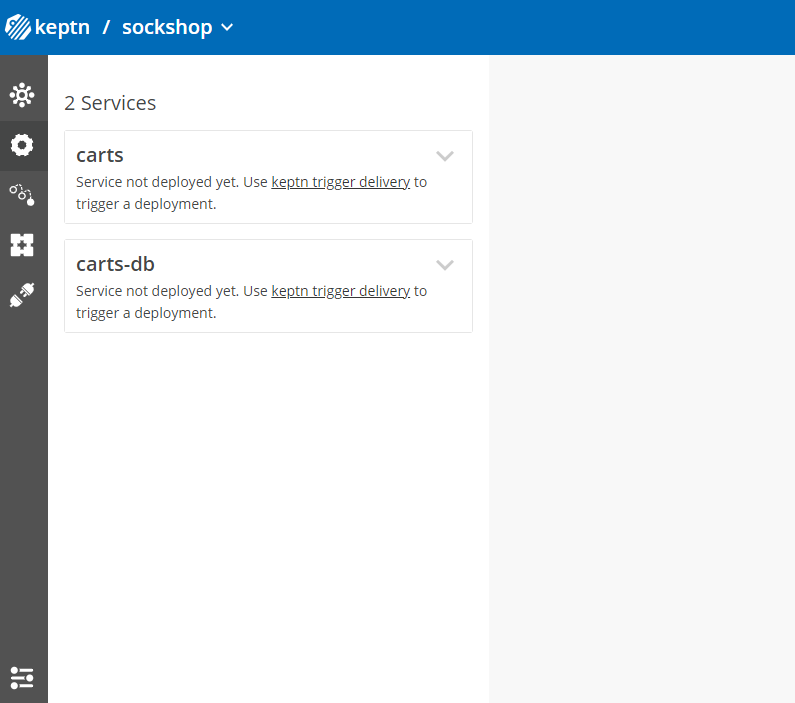
After onboarding the services, a built artifact of each service can be deployed.
- Deploy the carts-db service by executing the keptn send event new-artifact command:
keptn send event new-artifact --project=sockshop --service=carts-db --image=docker.io/mongo --tag=4.2.2 - Deploy the carts service by specifying the built artifact, which is stored on DockerHub and tagged with version 0.11.1:
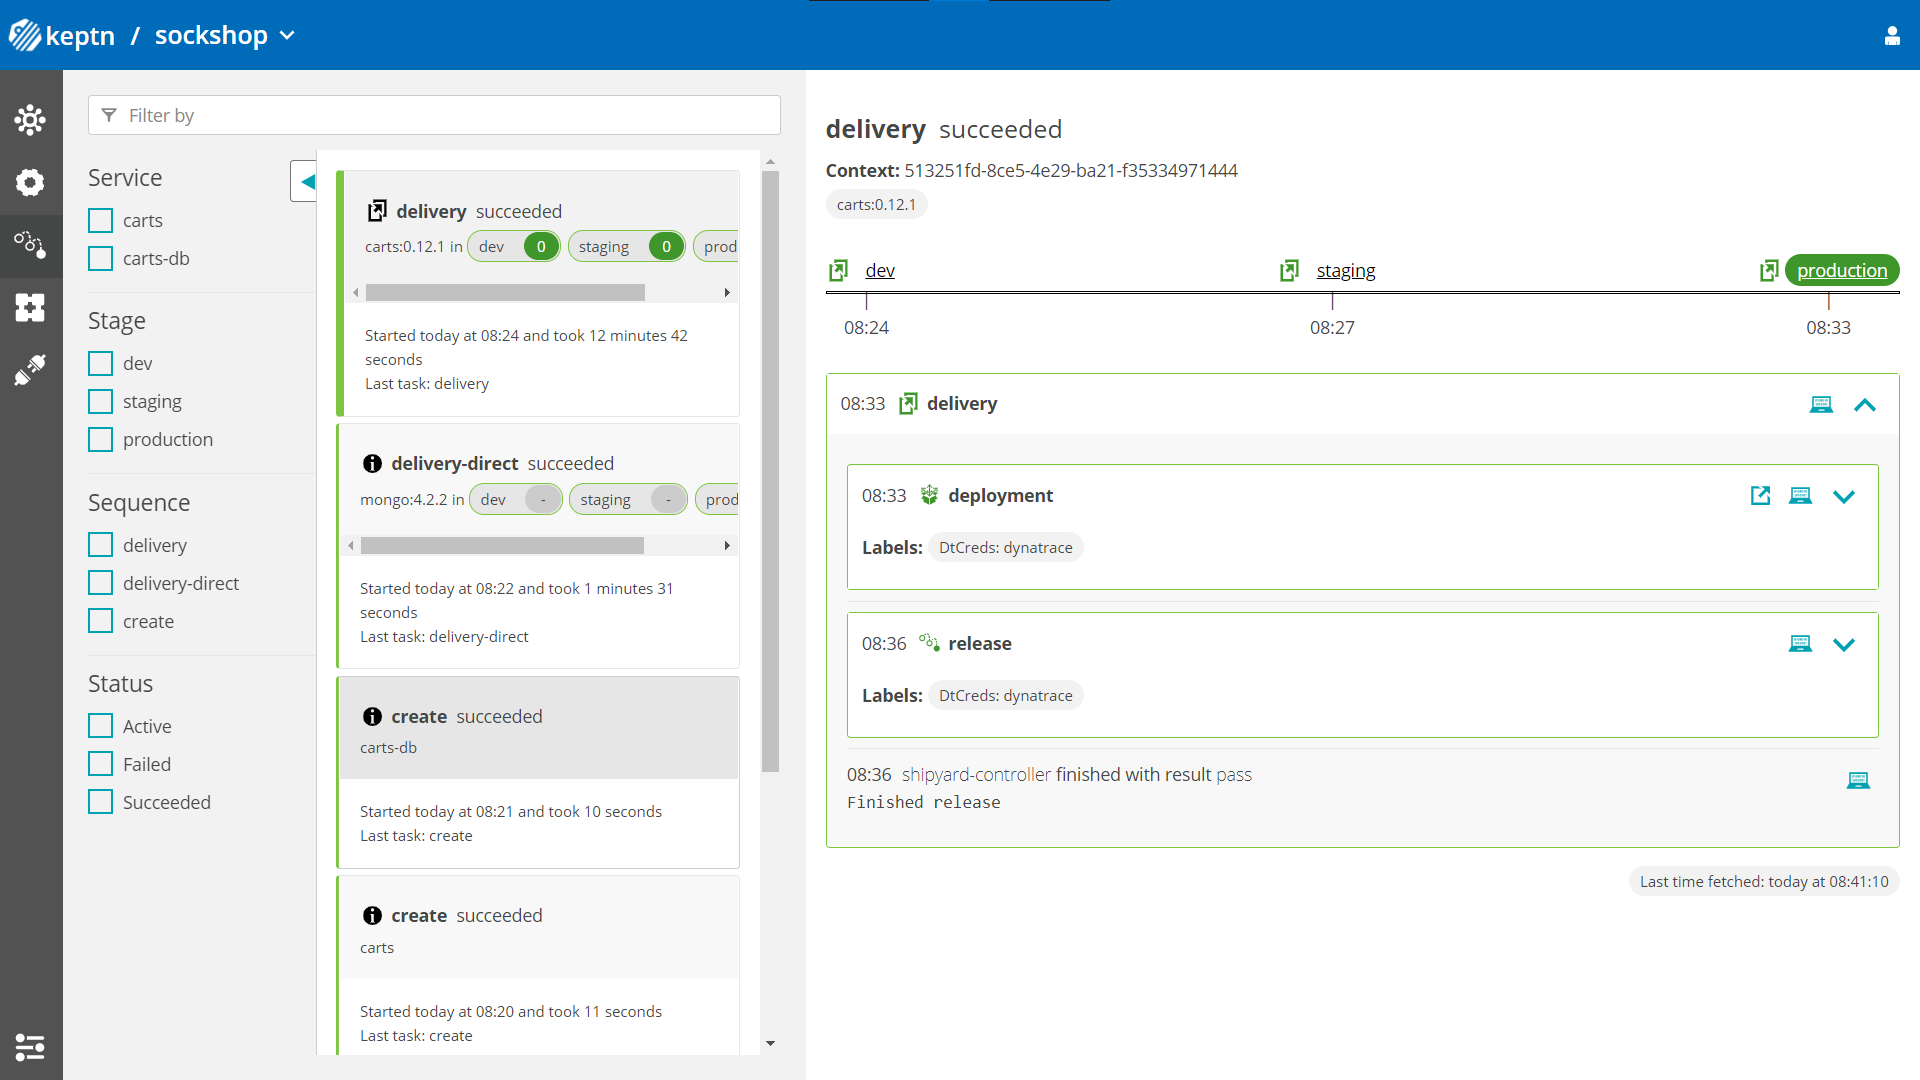
keptn send event new-artifact --project=sockshop --service=carts --image=docker.io/keptnexamples/carts --tag=0.11.1 - Go to Keptn's Bridge and check which events have already been generated.
- Optional: Verify the pods that should have been created for services carts and carts-db:
kubectl get pods --all-namespaces | grep carts-sockshop-dev carts-77dfdc664b-25b74 1/1 Running 0 10m sockshop-dev carts-db-54d9b6775-lmhf6 1/1 Running 0 13m sockshop-production carts-db-54d9b6775-4hlwn 2/2 Running 0 12m sockshop-production carts-primary-79bcc7c99f-bwdhg 2/2 Running 0 2m15s sockshop-staging carts-db-54d9b6775-rm8rw 2/2 Running 0 12m sockshop-staging carts-primary-79bcc7c99f-mbbgq 2/2 Running 0 7m24s
- Get the URL for your carts service with the following commands in the respective namespaces:
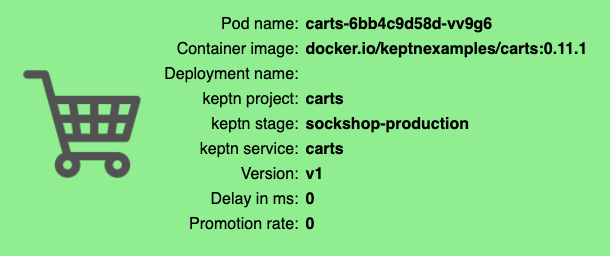
echo http://carts.sockshop-dev.$(kubectl -n keptn get ingress api-keptn-ingress -ojsonpath='{.spec.rules[0].host}')echo http://carts.sockshop-staging.$(kubectl -n keptn get ingress api-keptn-ingress -ojsonpath='{.spec.rules[0].host}')echo http://carts.sockshop-production.$(kubectl -n keptn get ingress api-keptn-ingress -ojsonpath='{.spec.rules[0].host}') - Navigate to the URLs to inspect the carts service. In the production namespace, you should receive an output similar to this:
Now that the service is running in all three stages, let us generate some traffic so we have some data we can base the evaluation on.
Change the directory to examples/load-generation/cartsloadgen. If you are still in the onboarding-carts directory, use the following command or change it accordingly:
cd ../load-generation/cartsloadgen
Now let us deploy a pod that will generate some traffic for all three stages of our demo environment.
kubectl apply -f deploy/cartsloadgen-base.yaml
The output will look similar to this.
namespace/loadgen created
deployment.extensions/cartsloadgen created
Optionally, you can verify that the load generator has been started.
kubectl get pods -n loadgen
NAME                            READY   STATUS    RESTARTS   AGE
cartsloadgen-5dc47c85cf-kqggb   1/1     Running   0          117s
During the evaluation of a quality gate, the Dynatrace SLI provider is required that is implemented by an internal Keptn service, the dynatrace-sli-service. This service will fetch the values for the SLIs that are referenced in an SLO configuration.
kubectl apply -f https://raw.githubusercontent.com/keptn-contrib/dynatrace-sli-service/0.7.1/deploy/service.yaml -n keptn
Next we are going to add an SLI configuration file for Keptn to know how to retrieve the data.
Please make sure you are in the correct folder that is examples/onboarding-carts. If not, please change the directory accordingly, e.g., with cd ../../onboarding-carts/. We are going to add it globally to the project for all services and stages we create.
keptn add-resource --project=sockshop --resource=sli-config-dynatrace.yaml --resourceUri=dynatrace/sli.yaml
For your information, this is what the file looks like:
---
spec_version: '1.0'
indicators:
  throughput: "builtin:service.requestCount.total:merge(\"dt.entity.service\"):sum?scope=tag(keptn_project:$PROJECT),tag(keptn_stage:$STAGE),tag(keptn_service:$SERVICE),tag(keptn_deployment:$DEPLOYMENT)"
  error_rate: "builtin:service.errors.total.count:merge(\"dt.entity.service\"):avg?scope=tag(keptn_project:$PROJECT),tag(keptn_stage:$STAGE),tag(keptn_service:$SERVICE),tag(keptn_deployment:$DEPLOYMENT)"
  response_time_p50: "builtin:service.response.time:merge(\"dt.entity.service\"):percentile(50)?scope=tag(keptn_project:$PROJECT),tag(keptn_stage:$STAGE),tag(keptn_service:$SERVICE),tag(keptn_deployment:$DEPLOYMENT)"
  response_time_p90: "builtin:service.response.time:merge(\"dt.entity.service\"):percentile(90)?scope=tag(keptn_project:$PROJECT),tag(keptn_stage:$STAGE),tag(keptn_service:$SERVICE),tag(keptn_deployment:$DEPLOYMENT)"
  response_time_p95: "builtin:service.response.time:merge(\"dt.entity.service\"):percentile(95)?scope=tag(keptn_project:$PROJECT),tag(keptn_stage:$STAGE),tag(keptn_service:$SERVICE),tag(keptn_deployment:$DEPLOYMENT)"
Configure the already onboarded project with the new SLI provider for Keptn to create some needed resources (e.g., a configmap):
keptn configure monitoring dynatrace --project=sockshop
To inform Keptn about any issues in a production environment, monitoring has to be set up correctly. The Keptn CLI helps with the automated setup and configuration of Dynatrace as the monitoring solution running in the Kubernetes cluster.
To add these files to Keptn and to automatically configure Dynatrace, execute the following commands:
- Make sure you are in the correct folder of your examples directory:
cd examples/onboarding-carts - Configure remediation actions for up-scaling based on Dynatrace alerts:
This is how the file looks that we are going to add here:keptn add-resource --project=sockshop --stage=production --service=carts --resource=remediation.yaml --resourceUri=remediation.yamlapiVersion: spec.keptn.sh/0.1.4 kind: Remediation metadata: name: service-remediation spec: remediations: - problemType: Response time degradation actionsOnOpen: - action: scaling name: scaling description: Scale up value: 1 - problemType: response_time_p90 actionsOnOpen: - action: scaling name: scaling description: Scale up value: 1 - Add an SLO file to the production stage for Keptn to do an evaluation if the remediation action was successful.
keptn add-resource --project=sockshop --stage=production --service=carts --resource=slo-self-healing.yaml --resourceUri=slo.yaml
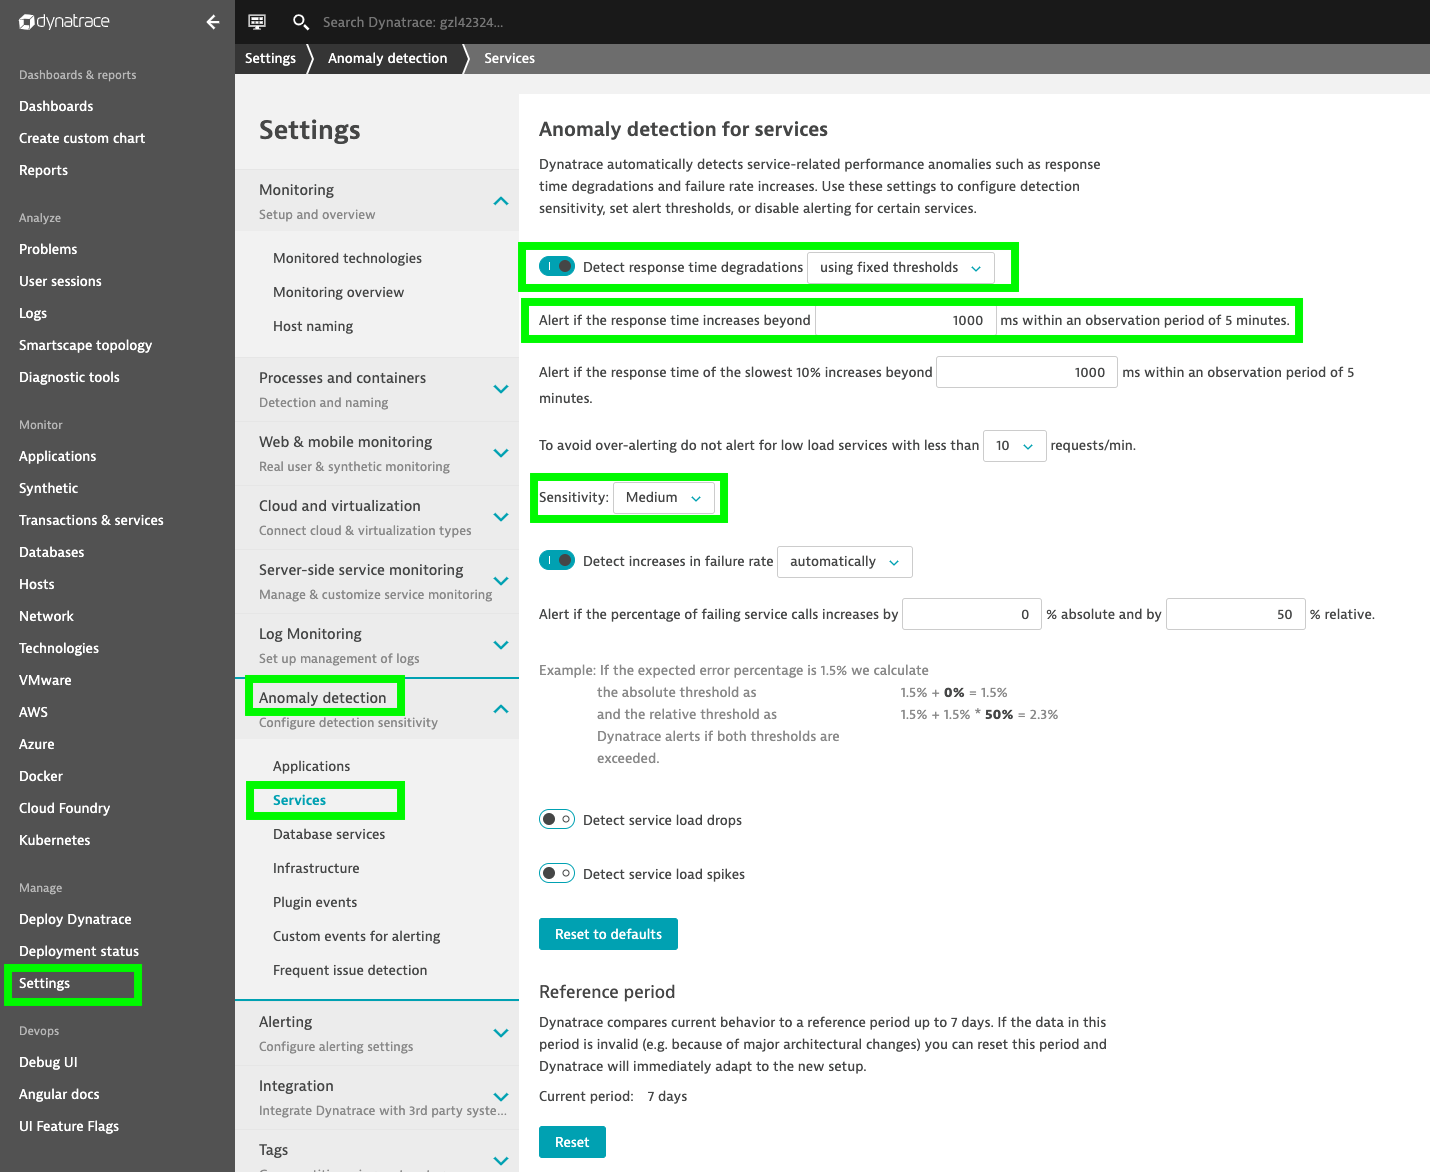
Configure Dynatrace problem detection with a fixed threshold: For the sake of this demo, we will configure Dynatrace to detect problems based on fixed thresholds rather than automatically.
Log in to your Dynatrace tenant and go to Settings > Anomaly Detection > Services.
Within this menu, select the option Detect response time degradations using fixed thresholds, set the limit to 1000ms, and select Medium for the sensitivity as shown below.
To simulate user traffic that is causing an unhealthy behavior in the carts service, please execute the following script. This will add special items into the shopping cart that cause some extensive calculation.
- Move to the correct folder for the load generation scripts:
cd ../load-generation/cartsloadgen/deploy - Start the load generation script:
kubectl apply -f cartsloadgen-faulty.yaml - Optional: Verify the load in DynatraceIn your Dynatrace Tenant, inspect the Response Time chart of the correlating service entity of the carts microservice. Hint: You can find the service
in Dynatrace easier by selecting the management zone Keptn: sockshop production: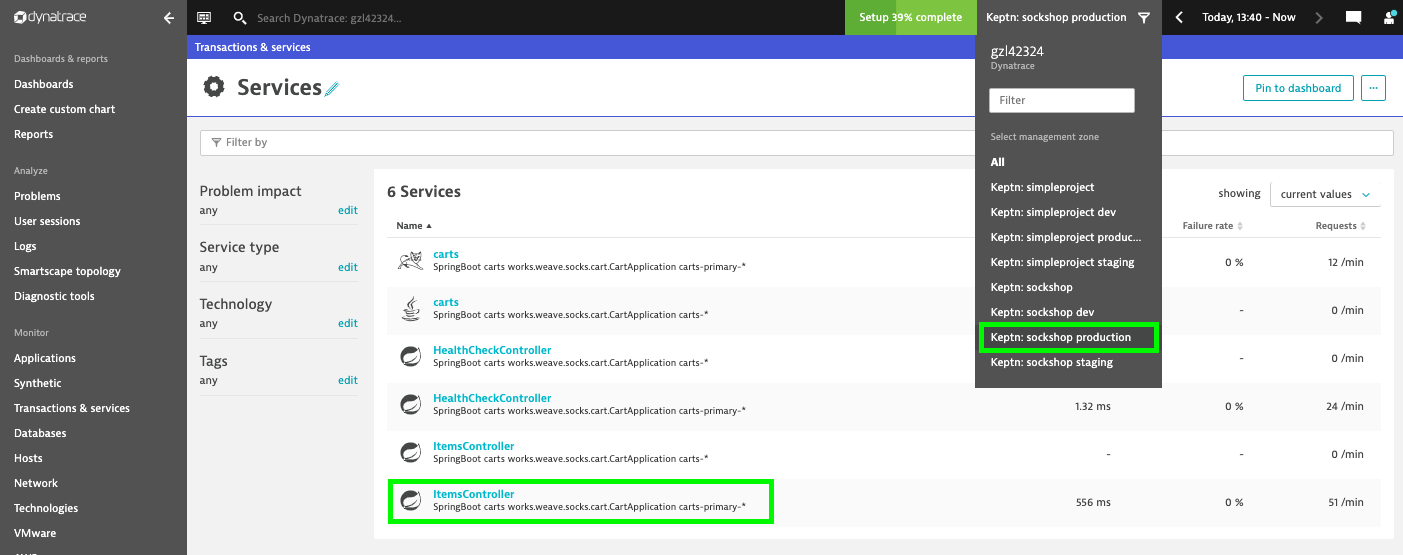
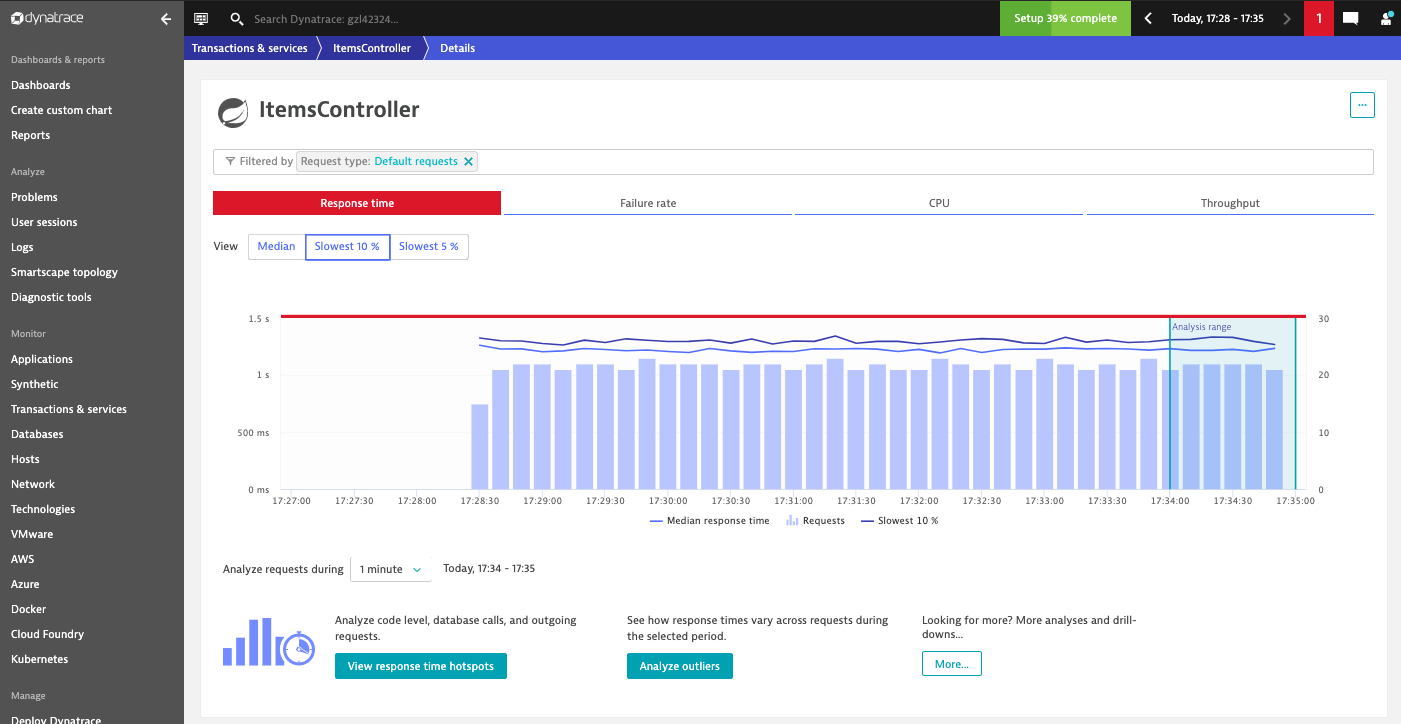
As you can see in the time series chart, the load generation script causes a significant increase in the response time.
After approximately 10-15 minutes, Dynatrace will send out a problem notification because of the response time degradation.
After receiving the problem notification, the dynatrace-service will translate it into a Keptn CloudEvent. This event will eventually be received by the remediation-service that will look for a remediation action specified for this type of problem and, if found, execute it.
In this tutorial, the number of pods will be increased to remediate the issue of the response time increase.
- Check the executed remediation actions by executing:
You can see that thekubectl get deployments -n sockshop-productioncarts-primarydeployment is now served by two pods:NAME DESIRED CURRENT UP-TO-DATE AVAILABLE AGE carts-db 1 1 1 1 37m carts-primary 2 2 2 2 32m - Besides, you should see an additional pod running when you execute:
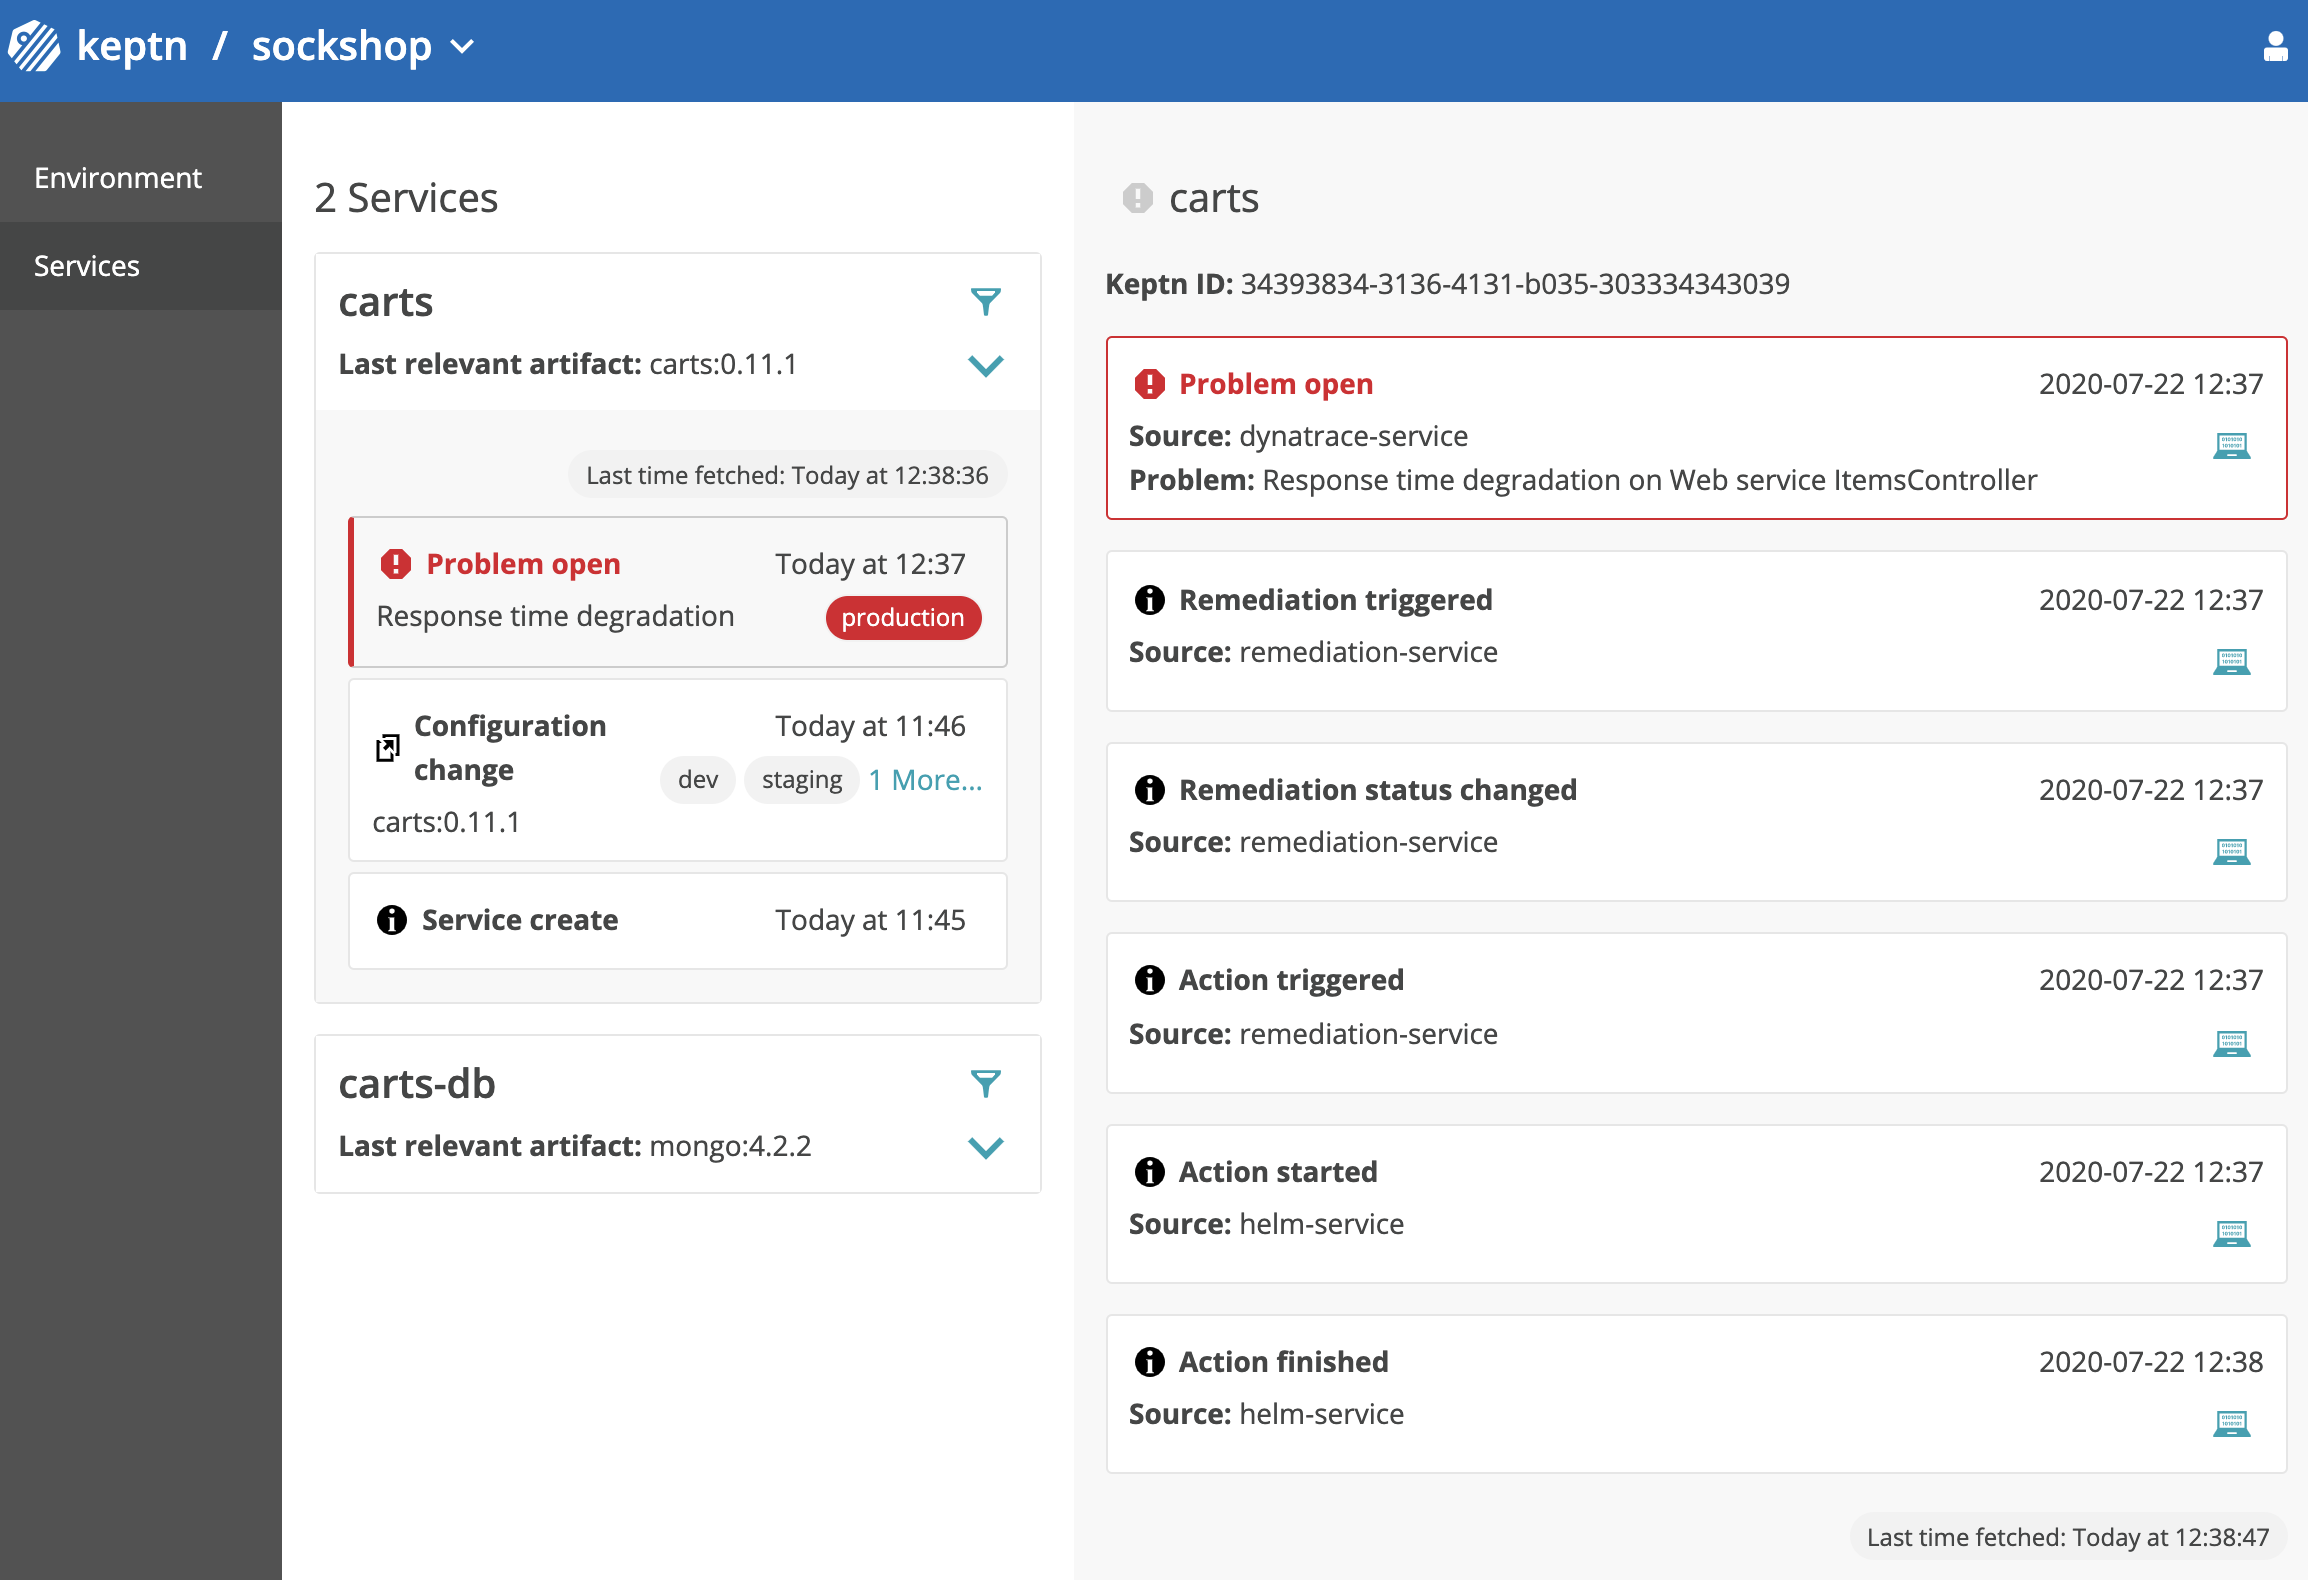
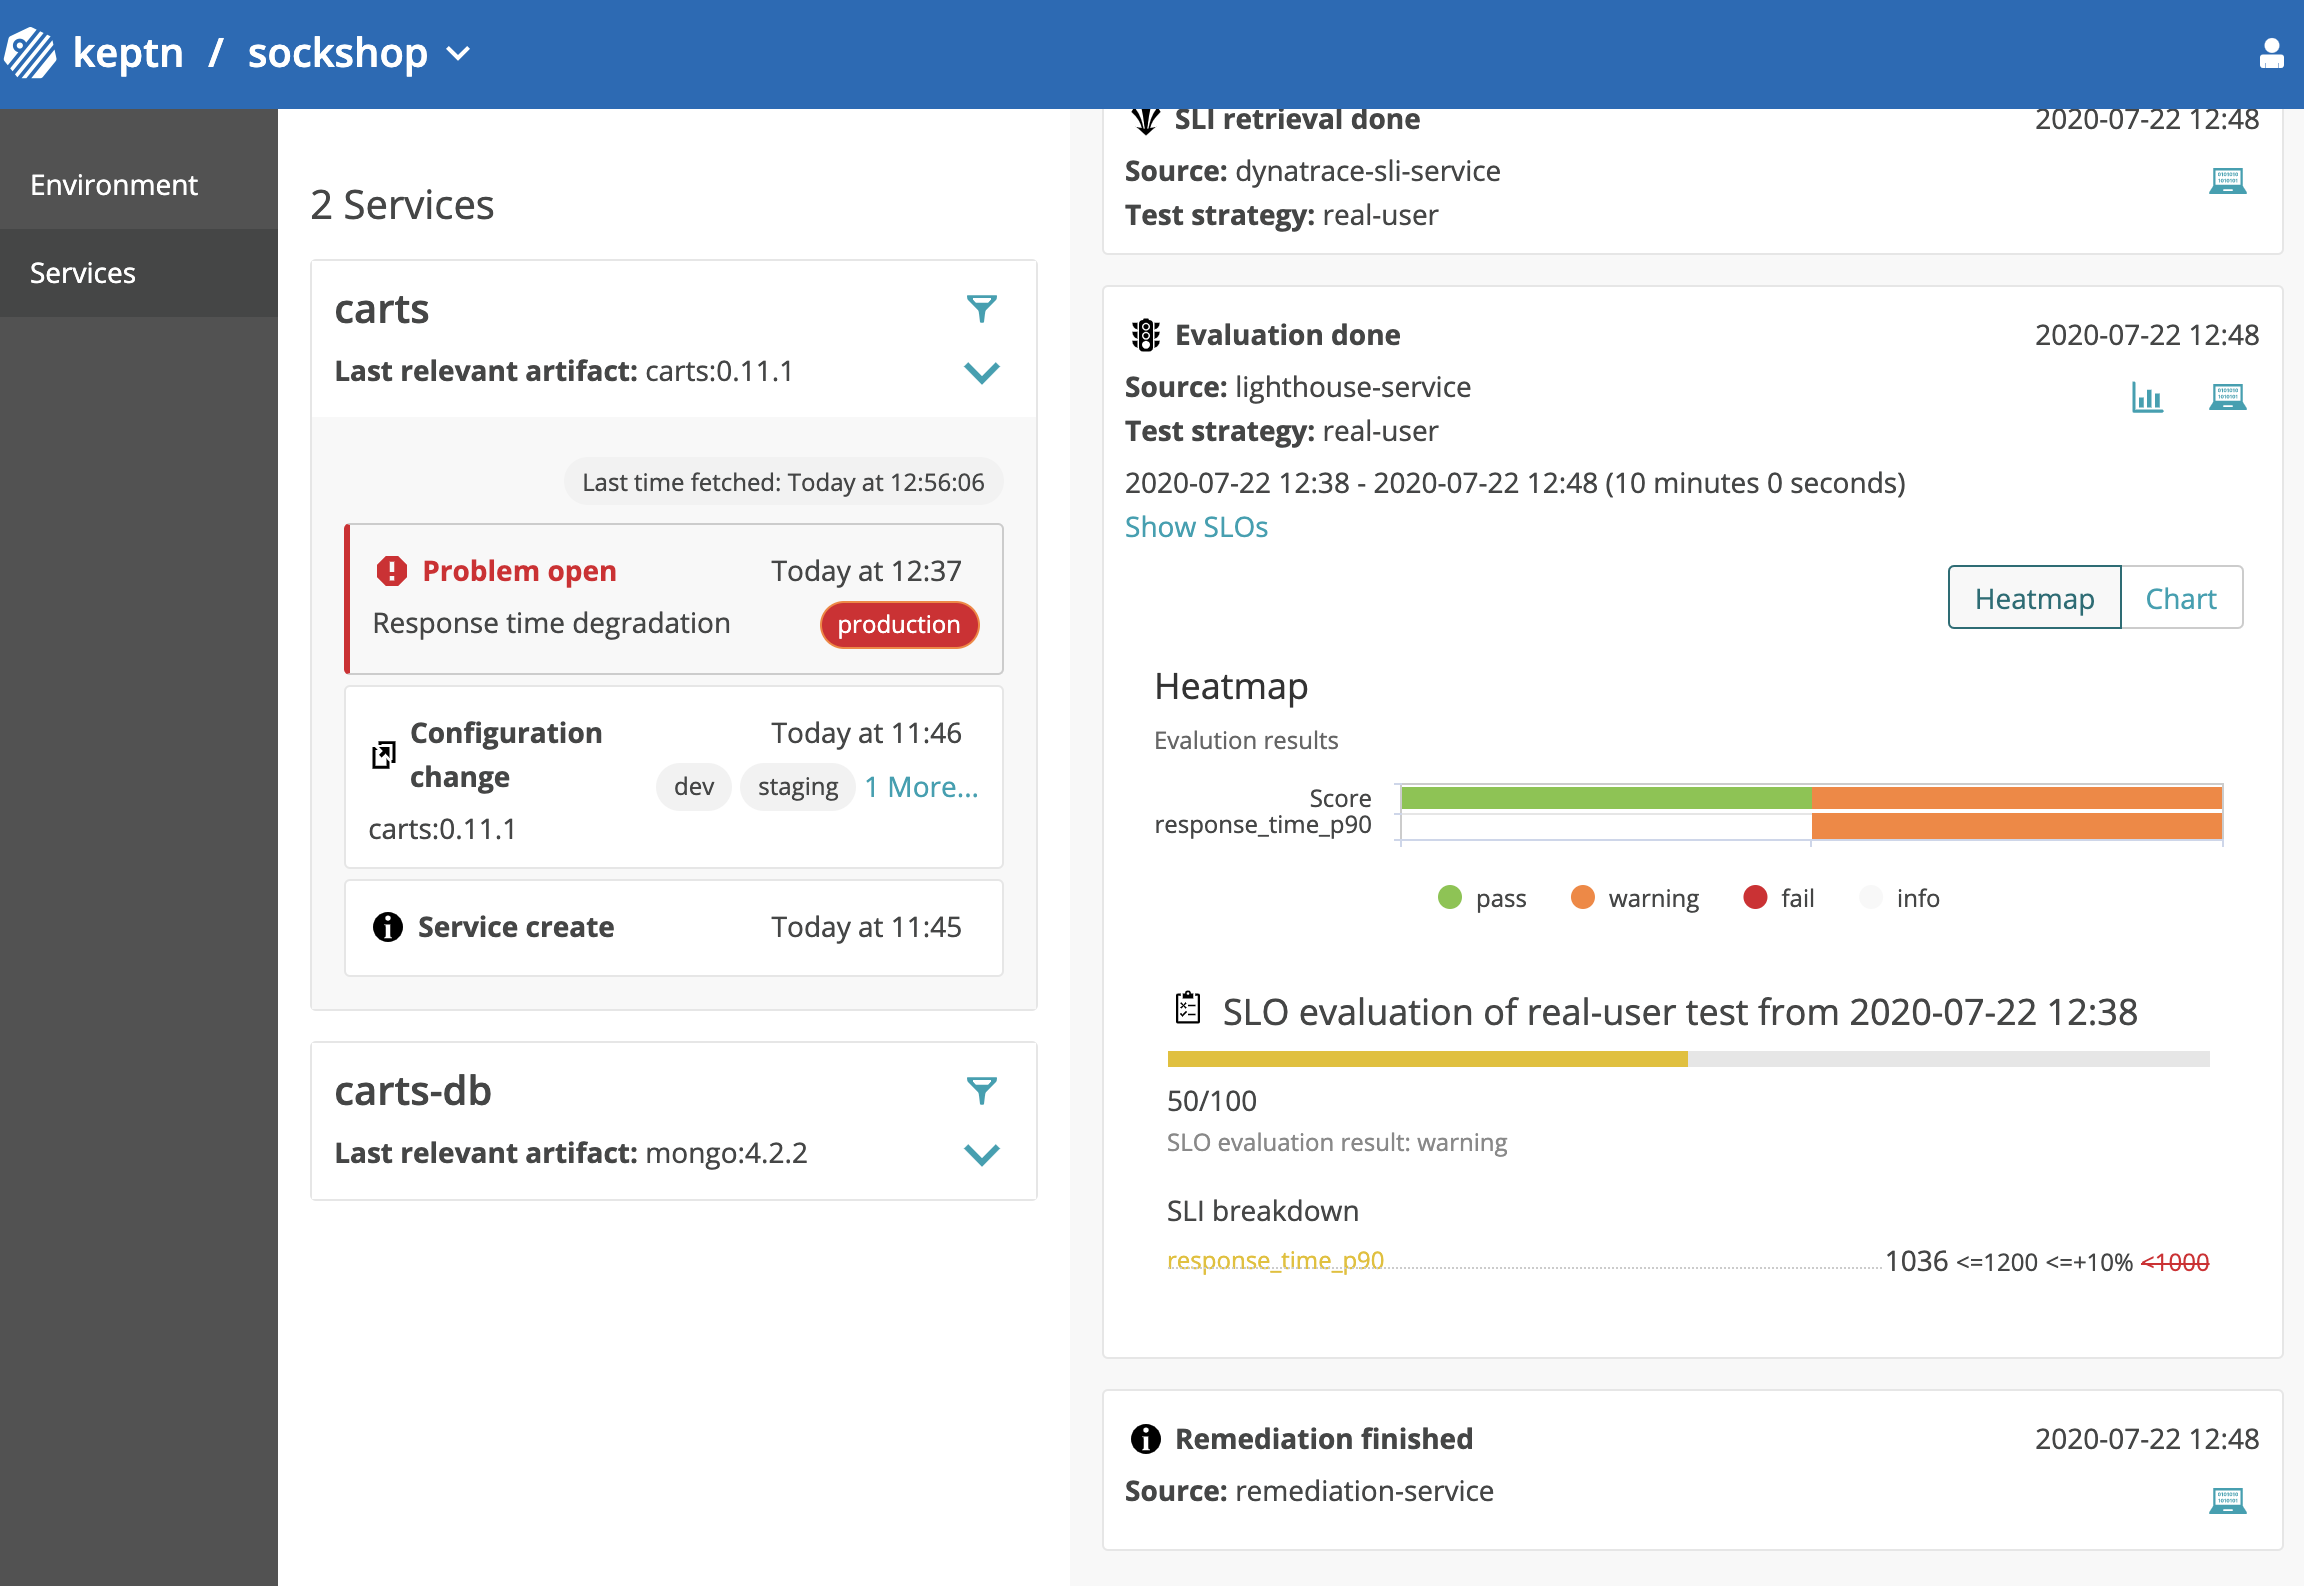
kubectl get pods -n sockshop-productionNAME READY STATUS RESTARTS AGE carts-db-57cd95557b-r6cg8 1/1 Running 0 38m carts-primary-7c96d87df9-75pg7 2/2 Running 0 33m carts-primary-7c96d87df9-78fh2 2/2 Running 0 5m - To get an overview of the actions that got triggered by the response time violation, you can use the Keptn's Bridge.In this example, the bridge shows that the remediation service triggered an update of the configuration of the carts service by increasing the number of replicas to 2. When the additional replica was available, the wait-service waited for 10 minutes for the remediation action to take effect. Afterwards, an evaluation by the lighthouse-service was triggered to check if the remediation action resolved the problem. In this case, increasing the number of replicas achieved the desired effect since the evaluation of the service level objectives has been successful.
- Furthermore, you can see how the response time of the service decreased by viewing the time series chart in Dynatrace:As previously, go to the response time chart of the ItemsController service. Here you will see that the additional instance has helped to bring down the response time.
Eventually, the problem that has been detected earlier will be closed automatically.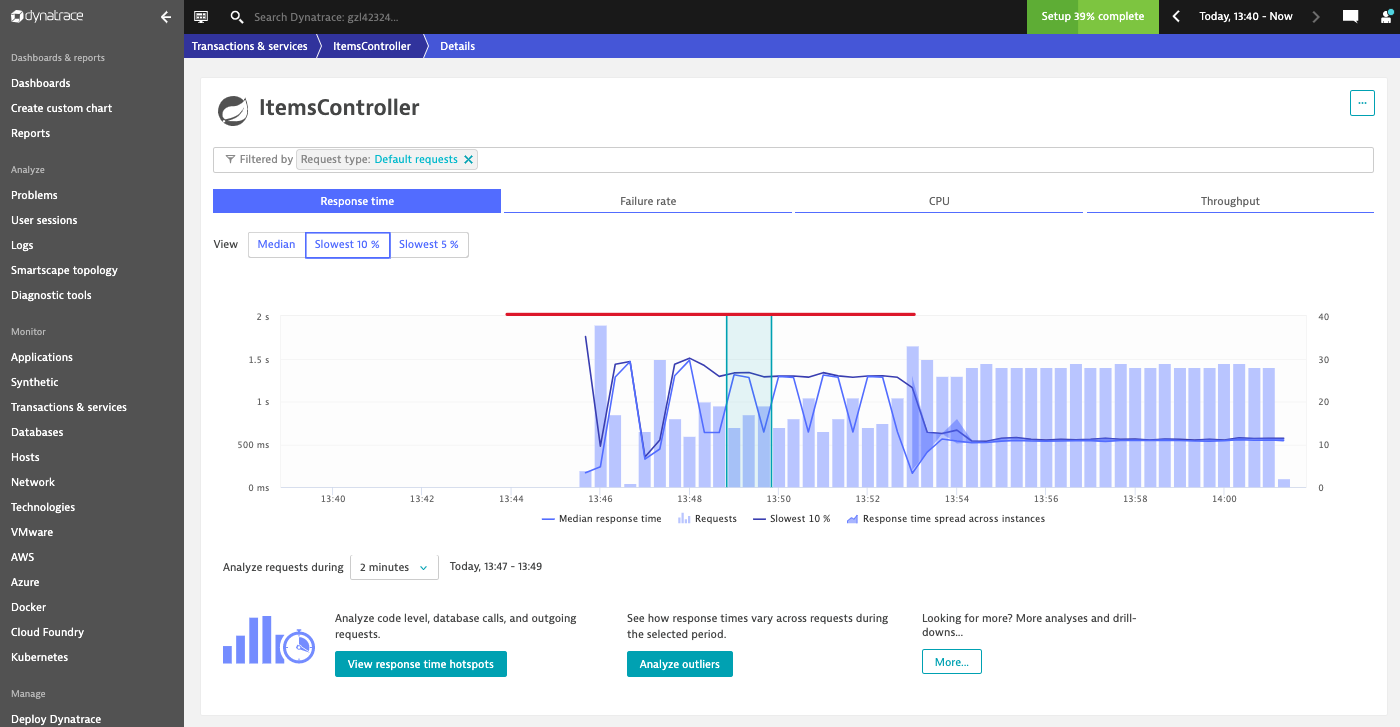
You have successfully walked through the example to scale up your application based on high CPU consumption detected by Dynatrace.
What we've covered
- Setting up auto-remediation with a
remediation.yamlfileapiVersion: spec.keptn.sh/0.1.4 kind: Remediation metadata: name: service-remediation spec: remediations: - problemType: Response time degradation actionsOnOpen: - action: scaling name: scaling description: Scale up value: 1 - problemType: response_time_p90 actionsOnOpen: - action: scaling name: scaling description: Scale up value: 1 - Execute an experiment to see self-healing in action

- Verified that Keptn executed the remediation action

Keptn can be easily extended with external tools such as notification tools, other SLI providers, bots to interact with Keptn, etc.
While we do not cover additional integrations in this tutorial, please feel fee to take a look at our integration repositories:
- Keptn Contrib lists mature Keptn integrations that you can use for your Keptn installation
- Keptn Sandbox collects mostly new integrations and those that are currently under development - however, you can also find useful integrations here.
Please visit us in our Keptn Slack and tell us how you like Keptn and this tutorial! We are happy to hear your thoughts & suggestions!
Also, make sure to follow us on Twitter to get the latest news on Keptn, our tutorials and newest releases!