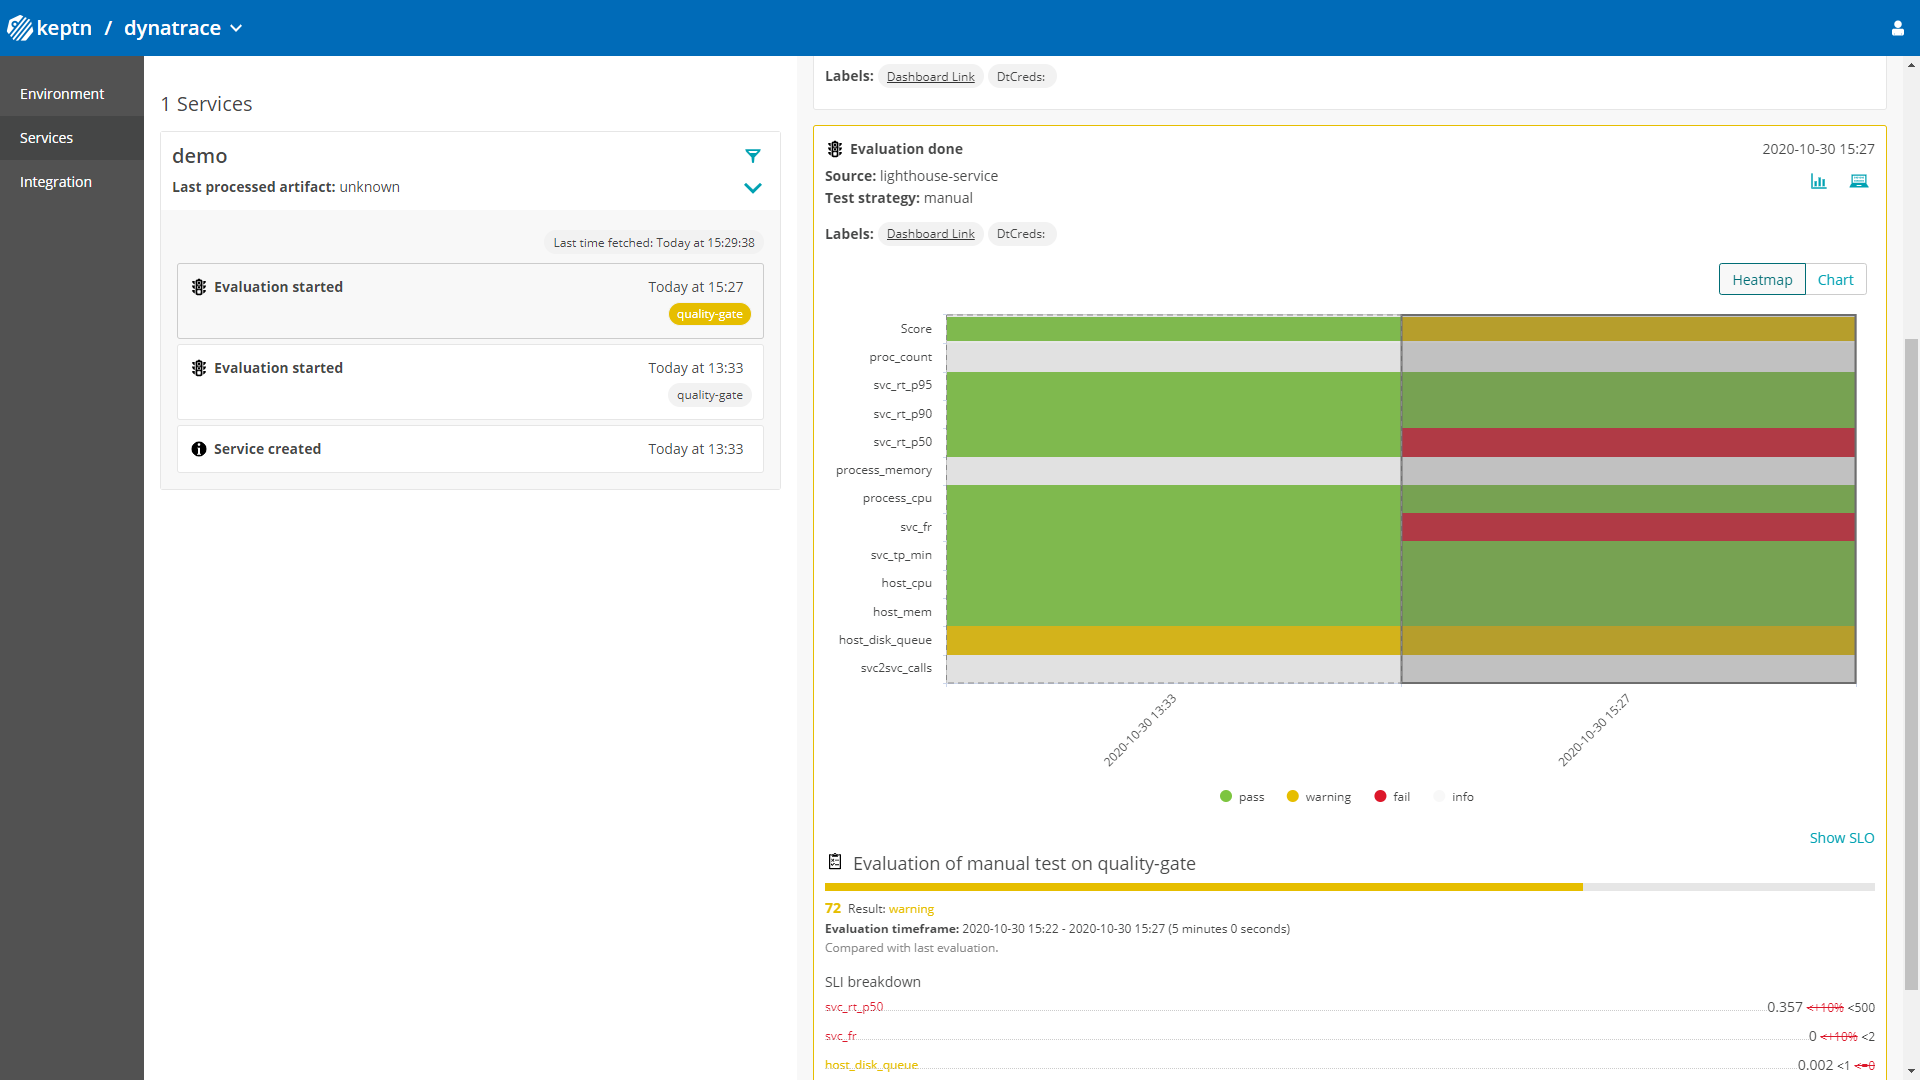
If you have tools that deploy your applications and then run tests against those you have done the hard work already. Keptn's Quality Gates help you to automate the evaluation of your test results and the monitoring data captured during your tests. Keptn does this by embracing the concept of Service Level Indicators (SLIs) and Service Level Objectives (SLOs). Essentially SLIs are metrics such as Response Time, Throughput, Error Rate, Number of Database Calls, Time spent in external service calls, ... and SLOs define which objective you have for these SLIs to consider your service to be adhering to what you expect, e.g: Response Time of Login should be faster than 200ms or Login should not make more than 1 database query.
Keptn didn't come up with these concepts. They have been around for a while and made very popular thanks to the work that Google did around Site Reliability Engineering
In this tutorial we teach you how you can use Keptn Quality Gates to automatically analyze important metrics (SLIs) that Dynatrace captures while your system is under load, e.g: during a load test and compare them against your expected behavior (SLOs). This comparison can either be against well defined thresholds, e.g: 200ms response time but can also be a comparison against previous test results, e.g: response time should not get slower than 10% of our previous build.
The real benefit is visualized in the following animation. Keptn Quality Gates help you automate the manual task of analyzing or comparing data on dashboards to determine whether a build meets your quality criteria.

We have initially created this tutorial on the Keptn Quality Gates for Dynatrace User in 5 Minutes GitHub page. We will merge it over to this tutorial format. As for now - please walk over and follow the steps as described here
Once you install Keptn based on the installation instructions you will automatically get a pre-configured quality gate project connected to your Dynatrace Environment which is ready to run quality gates:
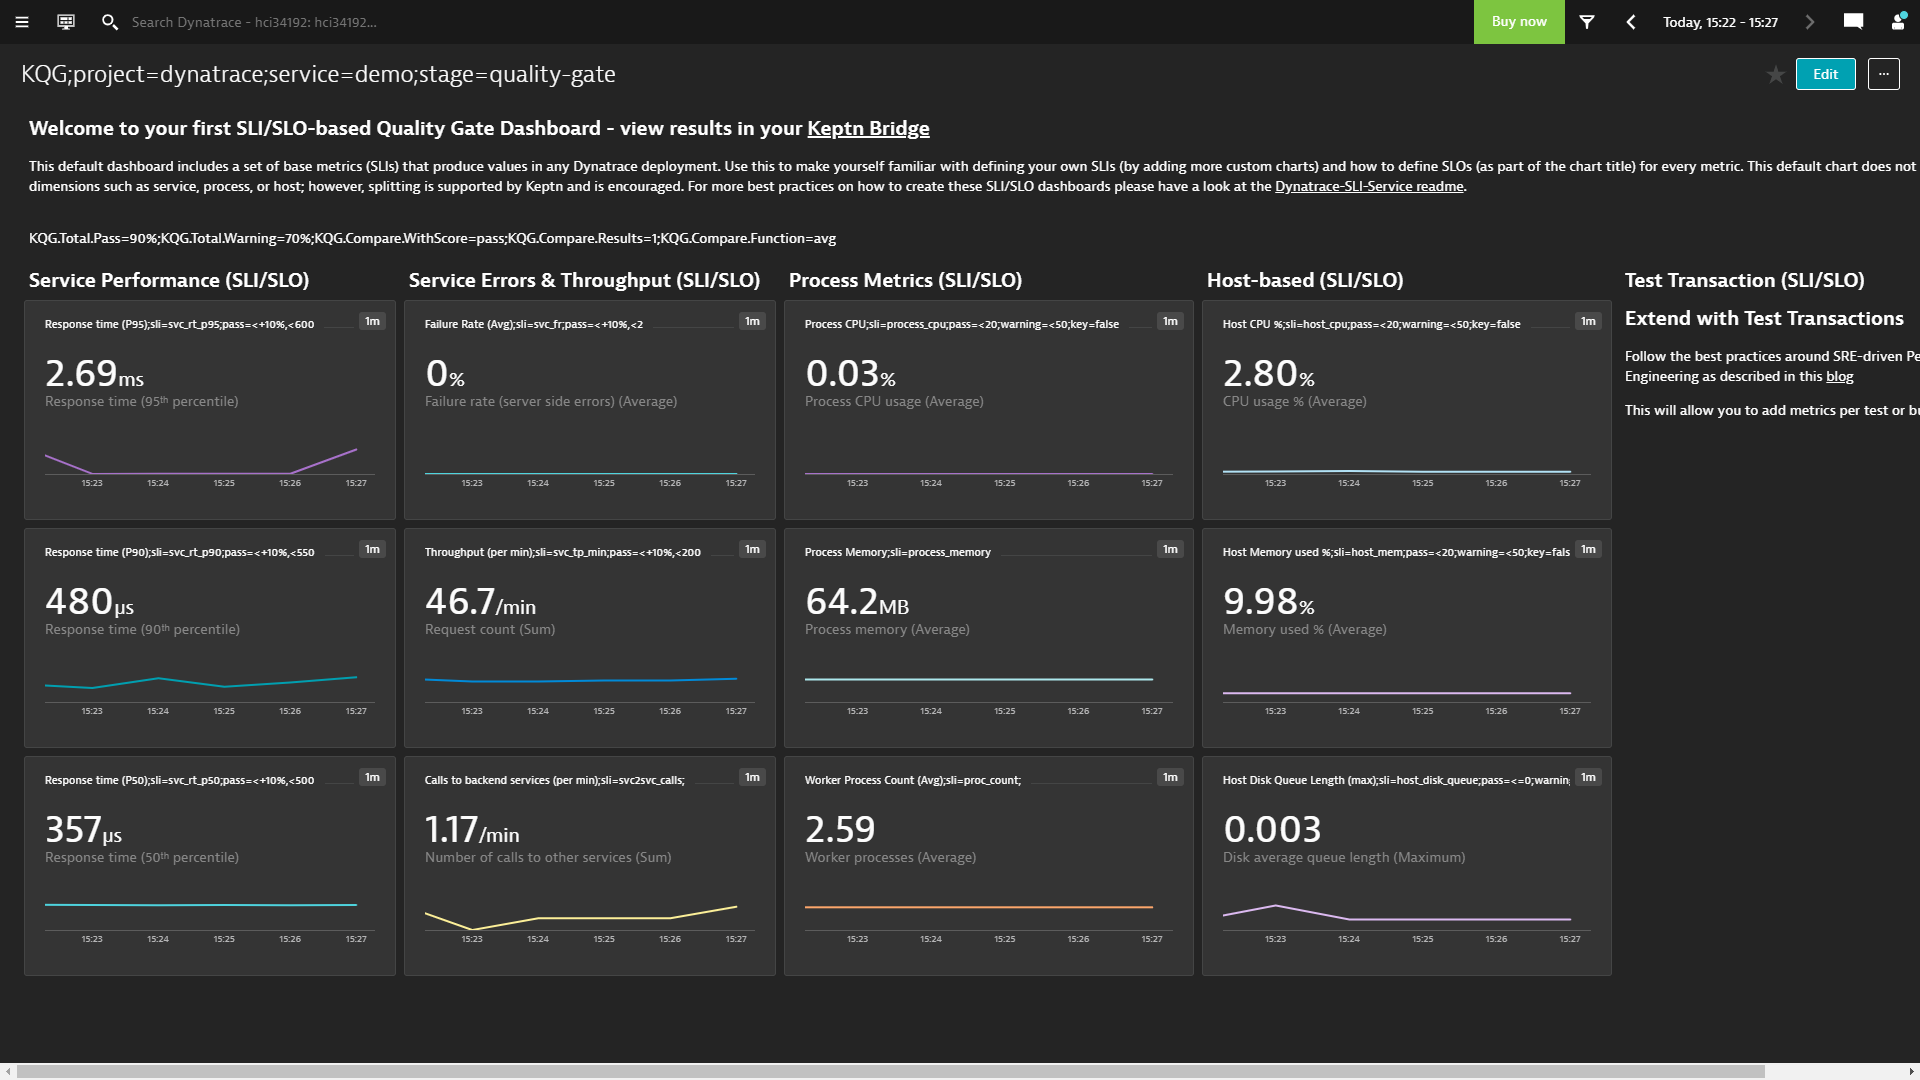
This tutorial already uses the new Dynatrace SLO Dashboard capabilities which pull data from a dashboard that looks like this:
To summarize - here is why you should run the GitHub tutorial:
- You only need a Linux machine with 4GB RAM & 1vCPU to setup keptn
- You can explore to the Dynatrace SLO dashboard capability of Keptn
- You can immediately run your quality after the installation completes
In this tutorial, you have learned how to use Keptn to validate the quality of your deployments by evaluating a set of SLIs (Service Level Indicators) against your SLOs (Service Level Objectives) for a specified timeframe! The overall goal is to use this capability to automate the manual evaluation of metrics through dashboards.
As you have now learned how to setup Keptn for pulling metrics out of Dynatrace the next step is that you do this with metrics that are important for your services, applications, processes and hosts. Think about how you can convert your Dynatrace dashboards into SLIs and SLOs and then have Keptn automate the analysis for you:

What we've covered
- Install Keptn and setup a Keptn Project for Quality Gate evaluation
- Prepare Dynatrace to act as a data source for Quality Gate evaluation
- Learn how to define and use service-level indicators (SLIs) and service-level objectives (SLOs)
- How to trigger a Keptn Quality Gate evaluation using the CLI and the API
- How to use the Keptn's Bridge to inspect your Quality Gate Results
Please visit us in our Keptn Slack and tell us how you like Keptn and this tutorial! We are happy to hear your thoughts & suggestions!
Also, make sure to follow us on Twitter to get the latest news on Keptn, our tutorials and newest releases!