In this tutorial, we'll set up a demo application and have it undergo some chaos in combination with load testing. We will then use Keptn quality gates to evaluate the resilience of the application based on SLO-driven quality gates.
What we will cover
- How to create a sample project and onboard a sample service
- How to setup quality gates
- How to add the Litmus integration and execute chaos
- How to evaluate application resilience
You'll find a time estimate until the end of this tutorial in the right top corner of your screen - this should give you guidance how much time is needed for each step.
In this tutorial, we are going to install Keptn on a Kubernetes cluster.
The full setup that we are going to deploy is sketched in the following image.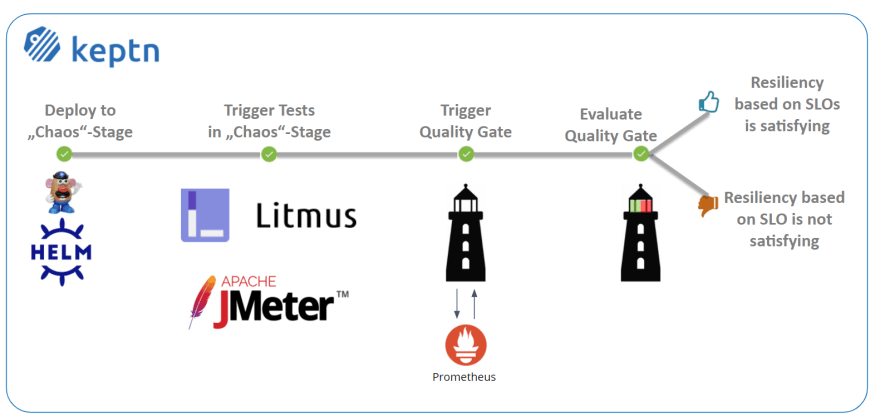
If you are interested, please have a look at this presentation from Litmus and Keptn maintainers presenting the initial integration.
Keptn can be installed on a variety of Kubernetes distributions. Please find a full compatibility matrix for supported Kubernetes versions here.
Please find tutorials how to set up your cluster here. For the best tutorial experience, please follow the sizing recommendations given in the tutorials.
Please make sure your environment matches these prerequisites:
- kubectl
- Linux or MacOS (preferred as some instructions are targeted for these platforms)
- On Windows: Git Bash 4 Windows, WSL
Download the Istio command line tool by following the official instructions or by executing the following steps.
curl -L https://istio.io/downloadIstio | ISTIO_VERSION=1.8.2 sh -
Check the version of Istio that has been downloaded and execute the installer from the corresponding folder, e.g.,
./istio-1.8.2/bin/istioctl install
The installation of Istio should be finished within a couple of minutes.
This will install the Istio default profile with ["Istio core" "Istiod" "Ingress gateways"] components into the cluster. Proceed? (y/N) y
✔ Istio core installed
✔ Istiod installed
✔ Ingress gateways installed
✔ Installation complete
Every release of Keptn provides binaries for the Keptn CLI. These binaries are available for Linux, macOS, and Windows.
There are multiple options how to get the Keptn CLI on your machine.
- Easiest option (works Linux, Mac OS, Windows with Bash, WSL2):
This will download and install the Keptn CLI in the specified version automatically.curl -sL https://get.keptn.sh | KEPTN_VERSION=0.8.4 bash - Using HomeBrew (on MacOs):
brew install keptn - Another option is to manually download the current release of the Keptn CLI:
- Download the version for your operating system and architecture from Download CLI
- Unpack the download
- Find the
keptnbinary (e.g.,keptn-0.8.4-amd64.exe) in the unpacked directory and rename it tokeptn - Linux / macOS: Add executable permissions (
chmod +x keptn), and move it to the desired destination (e.g.mv keptn /usr/local/bin/keptn)
- Windows: Copy the executable to the desired folder and add the executable to your PATH environment variable.
Now, you should be able to run the Keptn CLI:
- Linux / macOS
keptn --help - Windows
.\keptn.exe --help
To install the latest release of Keptn with full quality gate + continuous delivery capabilities in your Kubernetes cluster, execute the keptn install command.
keptn install --endpoint-service-type=ClusterIP --use-case=continuous-delivery
Installation details
In the Keptn namespace, the following deployments should be found:
kubectl get deployments -n keptn
Here is the output of the command:
NAME                          READY   UP-TO-DATE   AVAILABLE   AGE
api-gateway-nginx             1/1     1            1           2m44s
api-service                   1/1     1            1           2m44s
approval-service              1/1     1            1           2m44s
bridge                        1/1     1            1           2m44s
configuration-service         1/1     1            1           2m44s
helm-service                  1/1     1            1           2m44s
jmeter-service                1/1     1            1           2m44s
lighthouse-service            1/1     1            1           2m44s
litmus-service                1/1     1            1           2m44s
mongodb                       1/1     1            1           2m44s
mongodb-datastore             1/1     1            1           2m44s
remediation-service           1/1     1            1           2m44s
shipyard-controller           1/1     1            1           2m44s
statistics-service            1/1     1            1           2m44s
We are using Istio for traffic routing and as an ingress to our cluster. To make the setup experience as smooth as possible we have provided some scripts for your convenience. If you want to run the Istio configuration yourself step by step, please take a look at the Keptn documentation.
The first step for our configuration automation for Istio is downloading the configuration bash script from Github:
curl -o configure-istio.sh https://raw.githubusercontent.com/keptn/examples/release-0.8.4/istio-configuration/configure-istio.sh
After that you need to make the file executable using the chmod command.
chmod +x configure-istio.sh
Finally, let's run the configuration script to automatically create your Ingress resources.
./configure-istio.sh
What is actually created
With this script, you have created an Ingress based on the following manifest.
---
apiVersion: networking.k8s.io/v1beta1
kind: Ingress
metadata:
  annotations:
    kubernetes.io/ingress.class: istio
  name: api-keptn-ingress
  namespace: keptn
spec:
  rules:
  - host: <IP-ADDRESS>.nip.io
    http:
      paths:
      - backend:
          serviceName: api-gateway-nginx
          servicePort: 80
Besides, the script has created a gateway resource for you so that the onboarded services are also available publicly.
---
apiVersion: networking.istio.io/v1alpha3
kind: Gateway
metadata:
  name: public-gateway
  namespace: istio-system
spec:
  selector:
    istio: ingressgateway
  servers:
  - port:
      name: http
      number: 80
      protocol: HTTP
    hosts:
    - '*'
Besides, the helm-service pod of Keptn is restarted to fetch this new configuration.
In this section we are referring to the Linux/MacOS derivatives of the commands. If you are using a Windows host, please follow the official instructions.
KEPTN_ENDPOINT=http://$(kubectl -n keptn get ingress api-keptn-ingress -ojsonpath='{.spec.rules[0].host}')/api
KEPTN_API_TOKEN=$(kubectl get secret keptn-api-token -n keptn -ojsonpath='{.data.keptn-api-token}' | base64 --decode)
Use this stored information and authenticate the CLI.
keptn auth --endpoint=$KEPTN_ENDPOINT --api-token=$KEPTN_API_TOKEN
That will give you:
Starting to authenticate
Successfully authenticated
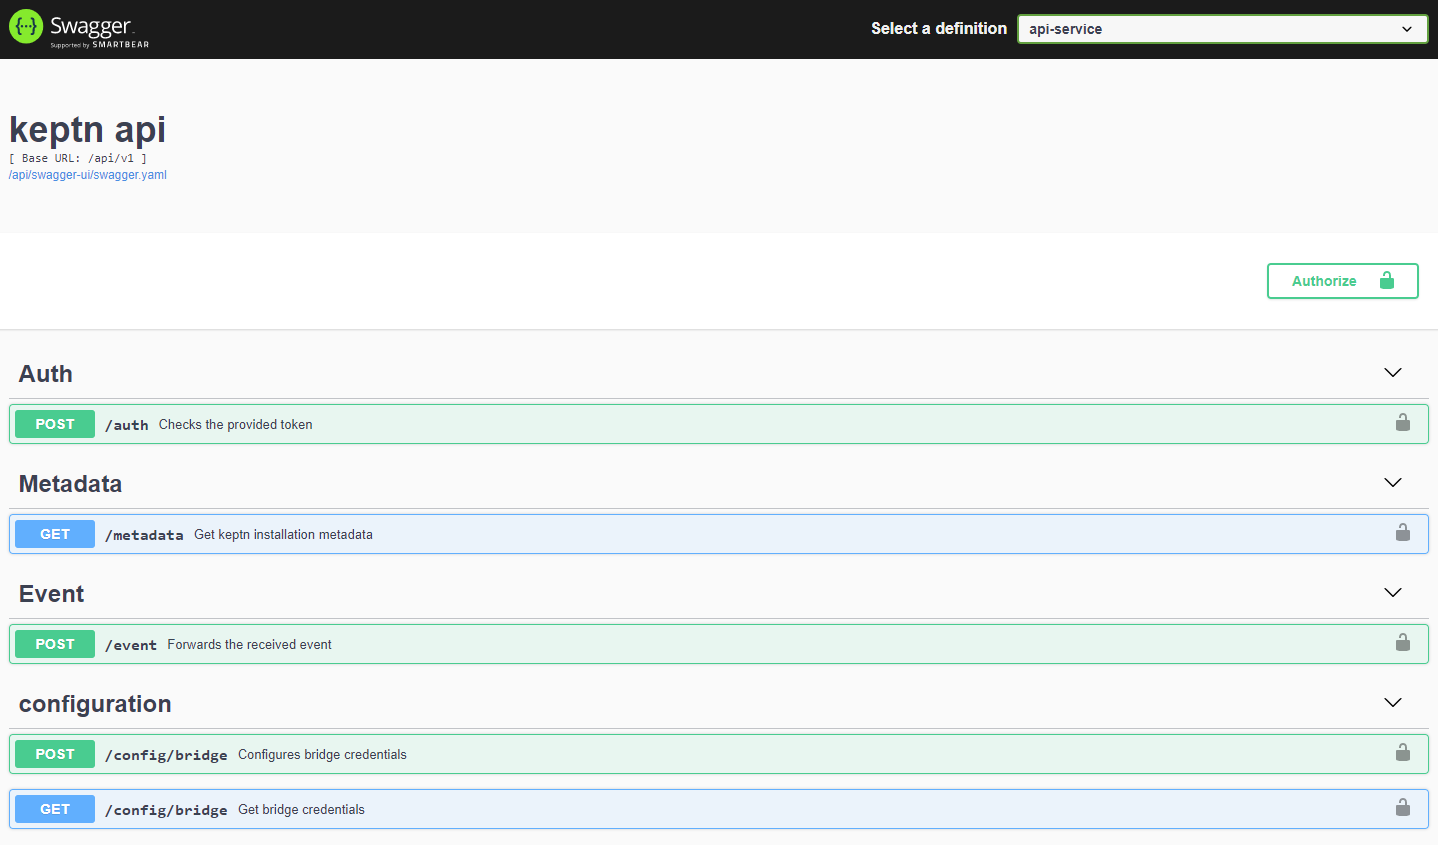
If you want, you can go ahead and take a look at the Keptn API by navigating to the endpoint that is given via
echo $KEPTN_ENDPOINT
Demo resources are prepared for you on Github for a convenient experience. We are going to download them to a local machine so we have them handy.
git clone --branch=release-0.2.0 https://github.com/keptn-sandbox/litmus-service.git --single-branch
Now, let's switch to the directory including the demo resources.
cd litmus-service/test-data
- Let us install LitmusChaos into our Kubernetes cluster. This can be done via
kubectl.kubectl apply -f ./litmus/litmus-operator-v1.13.2.yaml - We are going to create a namespace where we are later executing our chaos experiments.
kubectl create namespace litmus-chaos - We also need to create the custom resources for the experiments we want to run later, as well as some permissions.
kubectl apply -f ./litmus/pod-delete-ChaosExperiment-CR.yaml

kubectl apply -f ./litmus/pod-delete-rbac.yaml
Before we are going to create the project with Keptn, we'll install the Prometheus integration to be ready to fetch the data that is later on needed for the SLO-based quality gate evaluation.
Keptn doesn't install or manage Prometheus and its components. Users need to install Prometheus and Prometheus Alert manager as a prerequisite.
- To install the Prometheus and Alert Manager, execute:
kubectl create ns monitoring
helm repo add prometheus-community https://prometheus-community.github.io/helm-charts
helm install prometheus prometheus-community/prometheus --namespace monitoring
Execute the following steps to install prometheus-service
- Download the Keptn's Prometheus service manifest
kubectl apply -f https://raw.githubusercontent.com/keptn-contrib/prometheus-service/release-0.6.0/deploy/service.yaml - Replace the environment variable value according to the use case and apply the manifest
# Prometheus installed namespace kubectl set env deployment/prometheus-service -n keptn --containers="prometheus-service" PROMETHEUS_NS="monitoring" # Setup Prometheus Endpoint kubectl set env deployment/prometheus-service -n keptn --containers="prometheus-service" PROMETHEUS_ENDPOINT="http://prometheus-server.monitoring.svc.cluster.local:80" # Alert Manager installed namespace kubectl set env deployment/prometheus-service -n keptn --containers="prometheus-service" ALERT_MANAGER_NS="monitoring" - Install Role and Rolebinding to permit Keptn's prometheus-service for performing operations in the Prometheus installed namespace.
kubectl apply -f https://raw.githubusercontent.com/keptn-contrib/prometheus-service/release-0.6.0/deploy/role.yaml -n monitoring
Optional: Verify Prometheus setup in your cluster
- To verify that the Prometheus scrape jobs are correctly set up, you can access Prometheus by enabling port-forwarding for the prometheus-service:
kubectl port-forward svc/prometheus-server 8080:80 -n monitoring
Similar to the Prometheus integration, we are now adding the Litmus integration. This integration will be responsible to trigger the experiments with Litmus and listens for sh.keptn.event.test.triggered events that are sent from Keptn.
This can be done via the following command.
kubectl apply -f ../deploy/service.yaml
We now have all the integrations installed and connected to the Keptn control plane. Let's move on with setup up a project!
A project in Keptn is the logical unit that can hold multiple (micro)services. Therefore, it is the starting point for each Keptn installation.
We have already cloned the demo resources from Github, so we can go ahead and create the project.
Recommended: Create a new project with Git upstream:
To configure a Git upstream for this tutorial, the Git user (--git-user), an access token (--git-token), and the remote URL (--git-remote-url) are required. If a requirement is not met, go to the Keptn documentation where instructions for GitHub, GitLab, and Bitbucket are provided.
Let's define the variables before running the command:
GIT_USER=gitusername
GIT_TOKEN=gittoken
GIT_REMOTE_URL=remoteurl
Now let's create the project using the keptn create project command.
keptn create project litmus --shipyard=./shipyard.yaml --git-user=$GIT_USER --git-token=$GIT_TOKEN --git-remote-url=$GIT_REMOTE_URL
Alternatively: If you don't want to use a Git upstream, you can create a new project without it but please note that this is not the recommended way:
keptn create project litmus --shipyard=./shipyard.yaml
For creating the project, the tutorial relies on a shipyard.yaml file as shown below:
apiVersion: "spec.keptn.sh/0.2.0"
kind: "Shipyard"
metadata:
  name: "shipyard-litmus-chaos"
spec:
  stages:
    - name: "chaos"
      sequences:
        - name: "delivery"
          tasks:
            - name: "deployment"
              properties:
                deploymentstrategy: "direct"
            - name: "test"
              properties:
                teststrategy: "performance"
            - name: "evaluation"
In the shipyard.yaml shown above, we define a single stage called chaos with a single sequence called delivery. In this sequence, a deployment, test, and evaluation task is defined (along with some properties). With this, Keptn sets up the environment and makes sure, that tests are triggered after each deployment, and the tests are then evaluated by Keptn quality gates. As we do not have a subsequent stage, we do not need an approval or release task.
After creating the project, services can be onboarded to our project.
- Onboard the helloservice service using the keptn onboard service command:
keptn onboard service helloservice --project=litmus --chart=./helloservice/helm - After onboarding the service, tests need to be added as basis for quality gates. We are using JMeter tests, as the JMeter service comes "batteries included" with our Keptn installation. Although this could be changed to other testing tools, we are going with JMeter in this tutorial. Let's add some JMeter tests as well as a configuration file to Keptn.
keptn add-resource --project=litmus --stage=chaos --service=helloservice --resource=./jmeter/load.jmx --resourceUri=jmeter/load.jmx
keptn add-resource --project=litmus --stage=chaos --service=helloservice --resource=./jmeter/jmeter.conf.yaml --resourceUri=jmeter/jmeter.conf.yaml
Now each time Keptn triggers the test execution, the JMeter service will pick up both files and execute the tests.
We have not yet added our quality gate, i.e., the evaluation of several SLOs done by Keptn. Let's do this now!
- First, we are going to add an SLI file that holds all service-level indicators we want to evaluate along with their PromQL expressions. Learn more about the concept of Service-Level Indicators in the Keptn docs.
keptn add-resource --project=litmus --stage=chaos --service=helloservice --resource=./prometheus/sli.yaml --resourceUri=prometheus/sli.yaml - Now that we have added our SLIs, let us add the quality gate in terms of an
slo.yamlwhich adds objectives for our metrics that have to be satisfied. earn more about the concept of Service-Level Objectives in the Keptn docs.keptn add-resource --project=litmus --stage=chaos --service=helloservice --resource=helloservice/slo.yaml --resourceUri=slo.yaml
We've now added our quality gate, let's move on to add the chaos instructions and then run our experiment!
We have already installed LitmusChaos on our Kubernetes cluster, but we have not yet added or executed a chaos experiment. Let's do this now!
Let us add the experiment.yaml file that holds the chaos experiment instructions. It will be picked up by the LitmusChaos integration of Keptn each time a test is triggered. Therefore, Keptn makes sure that both, JMeter tests as well as LitmusChaos tests, are executed during the test task sequence.
keptn add-resource --project=litmus --stage=chaos --service=helloservice --resource=./litmus/experiment.yaml --resourceUri=litmus/experiment.yaml
Great job - the file is added and we can move on!
Before we are going to run the experiment, we have to make sure that we have some observability software in place that will actually monitor how the service is behaving under the testing conditions.
- Let's use the Keptn CLI to configure Prometheus. It will set up a Prometheus deployment and configures it to be ready for Keptn usage.
keptn configure monitoring prometheus --project=litmus --service=helloservice - Next, we are going to add a
blackbox-exporterfor Prometheus that is able to observe our service under test from the outside, i.e., as a blackbox.kubectl apply -f ./prometheus/blackbox-exporter.yaml kubectl apply -f ./prometheus/prometheus-server-conf-cm.yaml -n monitoring - Finally, restart Prometheus to pick up the new configuration
kubectl delete pod -l app=prometheus-server -n monitoring
Now everything is in place, let's run our experiments and evaluate the resilience of our demo application!
We are now ready to kick off a new deployment of our test application with Keptn and have it deployed, tested, and evaluated.
- Let us now trigger the deployment, tests, and evaluation of our demo application.
keptn trigger delivery --project=litmus --service=helloservice --image=jetzlstorfer/hello-server:v0.1.1 - Let's have a look in the Keptn bridge what is actually going on. We can use this helper command to retrieve the URL of our Keptn bridge.
The credentials can be retrieved via the Keptn CLI:echo http://$(kubectl -n keptn get ingress api-keptn-ingress -ojsonpath='{.spec.rules[0].host}')/bridgekeptn configure bridge --output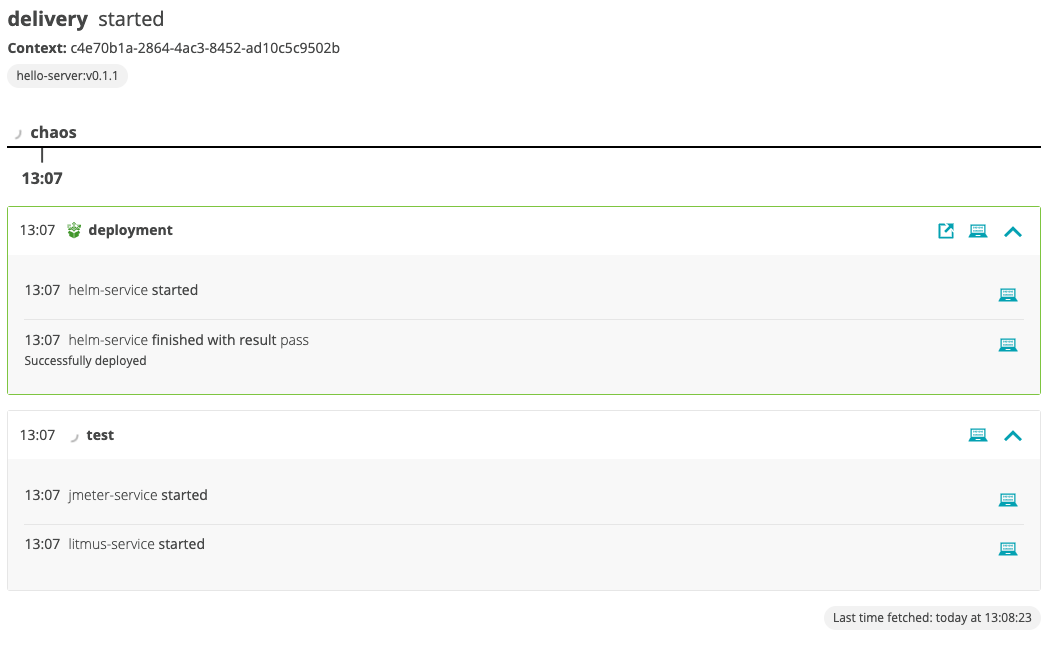
- We can see that the evaluation failed, but why is that?
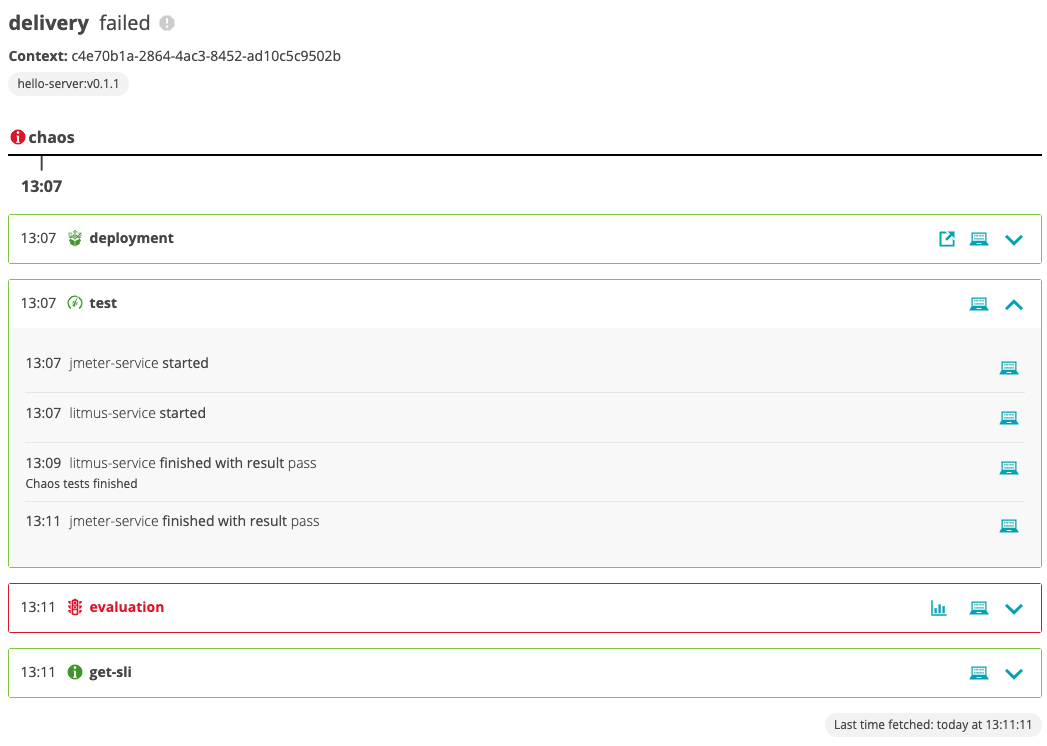
- Let's take a look at the evaluation - lick on the chart icon in the red evaluation tile.
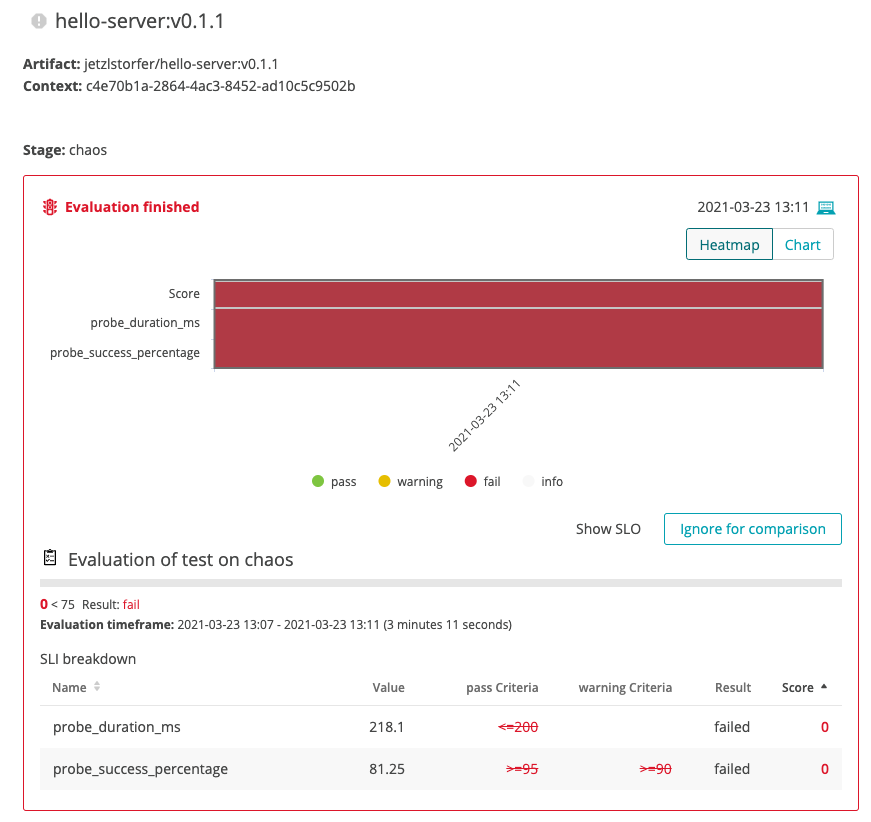 We can see that the evaluation failed because both the
 probe_duration_msas well as theprobe_success_percentageSLOs did not meet their criteria.
Considering the fact that our chaos experiment did delete the pod of our application, we might want to increase the number of replicas that are running to make our application more resilient. Let's do this in the next step.
- Let's do another run of our deployment, tests, and evaluation. But this time, we are increasing the
replicaCountmeaning that we run 3 instances of our application. If one of those get deleted by Litmus, the two others should still be able to serve the traffic.
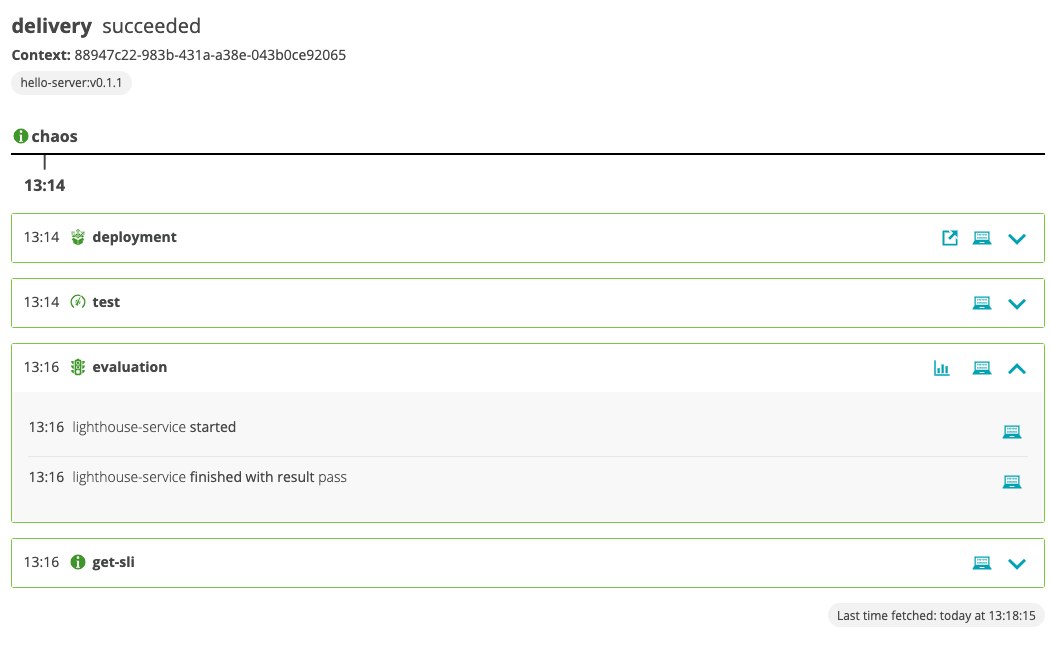
This time we are using thekeptn send eventcommand with an event payload that has been already prepared for the demo (i.e., thereplicaCountis set to 3).keptn send event -f helloservice/deploy-event.json - Let's have a look at the second run. We can see that this time the evaluation was successful.
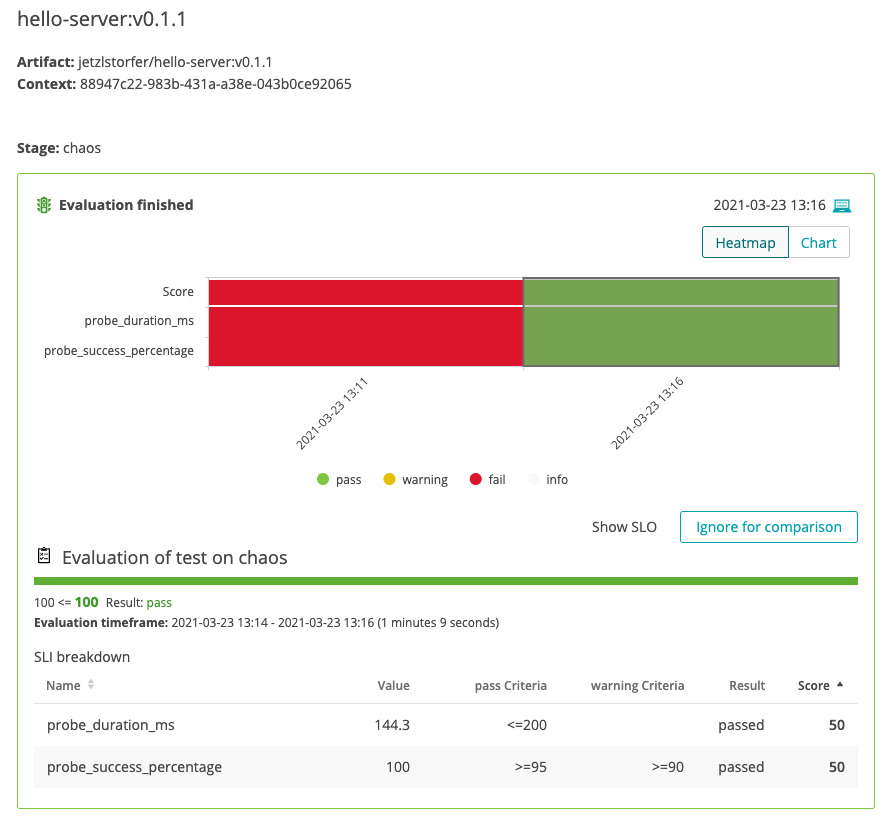
- Taking a look at the detailed evaluation results we can see that all probes were successful and did finish within the objectives we have set.
- If you want, you can now experiment with different SLOs or different
replicaCountto evaluate the resilience of your application in terms of being responsive when the pod of this application gets deleted. Keptn will make sure that JMeter tests and chaos tests are executed each time you run the experiment.
Congratulations! You have successfully completed this tutorial and evaluated the resilience of a demo microservice application with LitmusChaos and Keptn.
What we've covered in this tutorial
- We've created a project based on a
shipyarddefinition.apiVersion: "spec.keptn.sh/0.2.0" kind: "Shipyard" metadata: name: "shipyard-litmus-chaos" spec: stages: - name: "chaos" sequences: - name: "delivery" tasks: - name: "deployment" properties: deploymentstrategy: "direct" - name: "test" properties: teststrategy: "performance" - name: "evaluation" - We've added the Litmus integration and did a successful run of a sequence with JMeter + LitmusChaos

- We've executed chaos tests and evaluated their impact on our application

- We've increased resilience by adding more instances of our demo application to the game

Please visit us in our Keptn Slack and tell us how you like Keptn and this tutorial! We are happy to hear your thoughts & suggestions!
Also, make sure to follow us on Twitter to get the latest news on Keptn, our tutorials and newest releases!